
Over the past six months, Verizon’s shares (currently trading at $40.24) have posted a disappointing 8.8% loss, well below the S&P 500’s 13.4% gain. This might have investors contemplating their next move.
Is now the time to buy Verizon, or should you be careful about including it in your portfolio? Get the full breakdown from our expert analysts, it’s free for active Edge members.
Why Do We Think Verizon Will Underperform?
Despite the more favorable entry price, we're cautious about Verizon. Here are three reasons there are better opportunities than VZ and a stock we'd rather own.
1. Customer Base Hits a Plateau
Revenue growth can be broken down into the number of customers and the average spend per customer. Both are important because an increasing customer base leads to more upselling opportunities while the revenue per customer shows how successful a company was in executing its upselling strategy.
Over the last two years, Verizon’s total customers were flat, coming in at 146.1 million in the latest quarter. This performance was underwhelming and shows the company faced challenges in landing new contracts. It also suggests there may be increasing competition or market saturation. 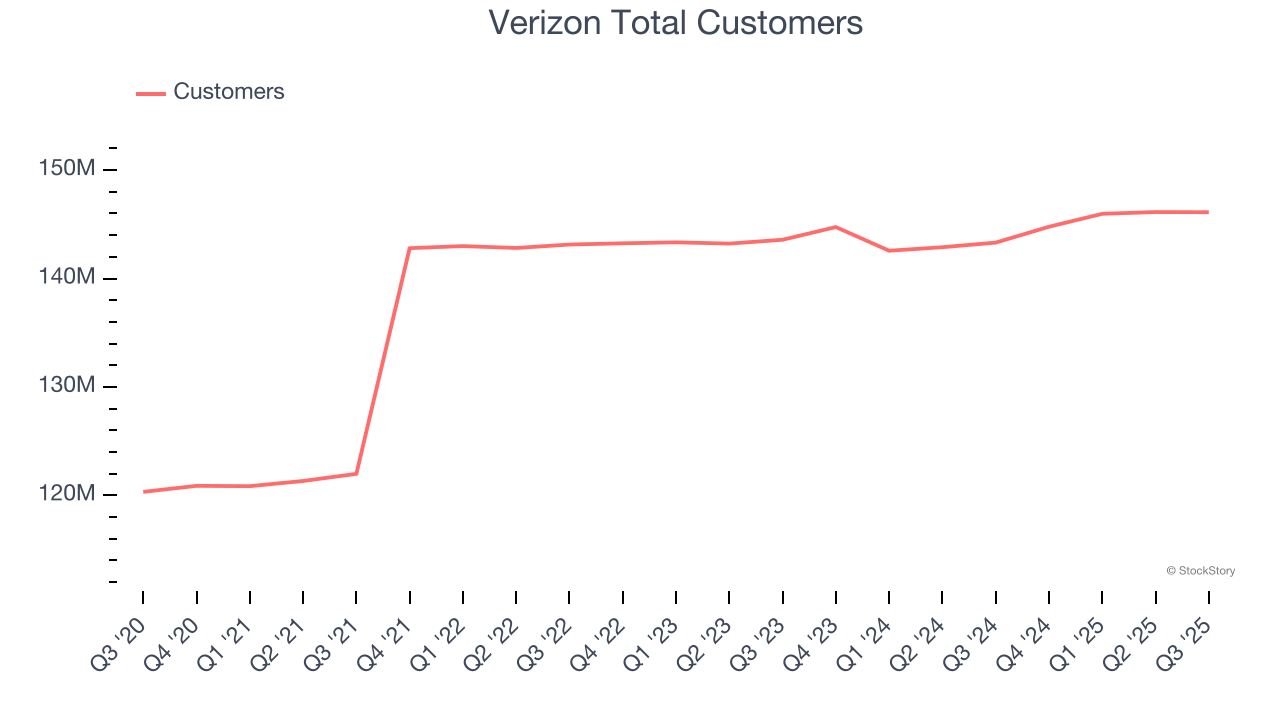
2. Free Cash Flow Projections Disappoint
Free cash flow isn't a prominently featured metric in company financials and earnings releases, but we think it's telling because it accounts for all operating and capital expenses, making it tough to manipulate. Cash is king.
Over the next year, analysts’ consensus estimates show they’re expecting Verizon’s free cash flow margin of 15.4% for the last 12 months to remain the same.
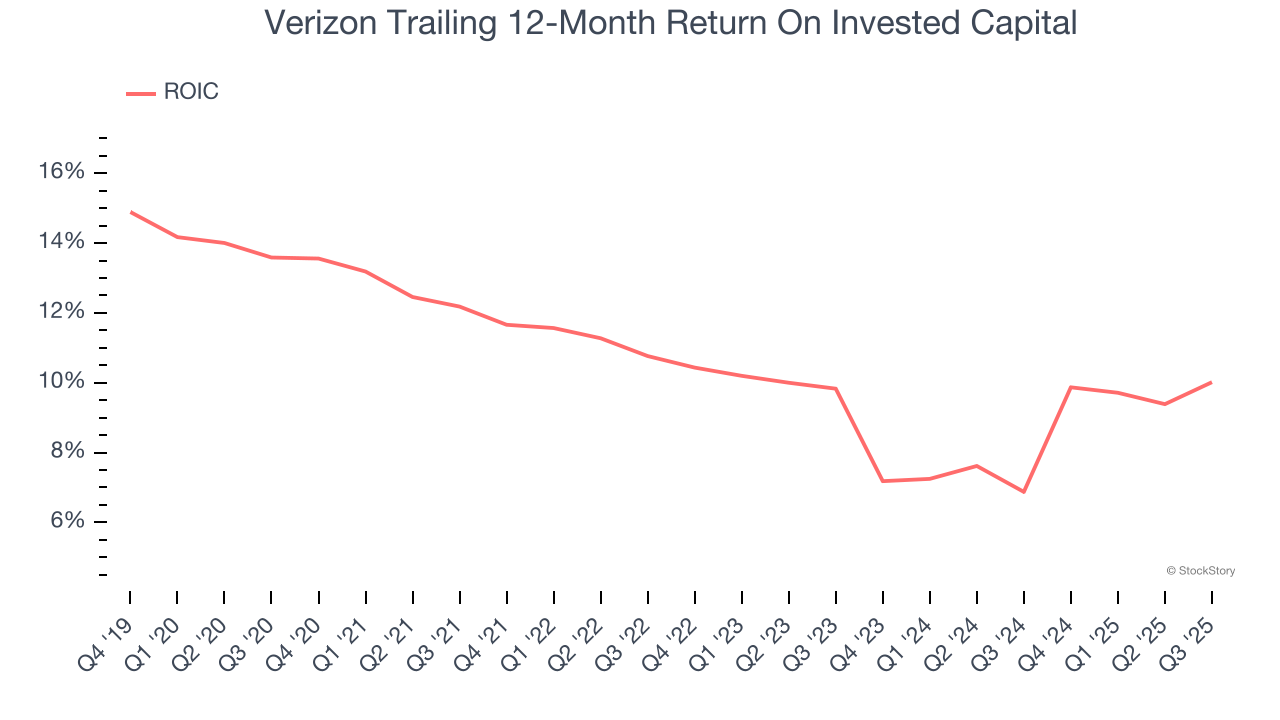
3. New Investments Fail to Bear Fruit as ROIC Declines
A company’s ROIC, or return on invested capital, shows how much operating profit it makes compared to the money it has raised (debt and equity).
We like to invest in businesses with high returns, but the trend in a company’s ROIC is what often surprises the market and moves the stock price. Over the last few years, Verizon’s ROIC averaged 3 percentage point decreases each year. Paired with its already low returns, these declines suggest its profitable growth opportunities are few and far between.
Final Judgment
We cheer for all companies serving everyday consumers, but in the case of Verizon, we’ll be cheering from the sidelines. After the recent drawdown, the stock trades at 8.7× forward P/E (or $40.24 per share). While this valuation is optically cheap, the potential downside is huge given its shaky fundamentals. There are better investments elsewhere. Let us point you toward the Amazon and PayPal of Latin America.
High-Quality Stocks for All Market Conditions
Your portfolio can’t afford to be based on yesterday’s story. The risk in a handful of heavily crowded stocks is rising daily.
The names generating the next wave of massive growth are right here in our Top 6 Stocks for this week. This is a curated list of our High Quality stocks that have generated a market-beating return of 244% over the last five years (as of June 30, 2025).
Stocks that have made our list include now familiar names such as Nvidia (+1,326% between June 2020 and June 2025) as well as under-the-radar businesses like the once-micro-cap company Tecnoglass (+1,754% five-year return). Find your next big winner with StockStory today.
StockStory is growing and hiring equity analyst and marketing roles. Are you a 0 to 1 builder passionate about the markets and AI? See the open roles here.


