ETFOptimize | High-performance ETF-based Investment Strategies

Quantitative strategies, Wall Street-caliber research, and insightful market analysis since 1998.


ETFOptimize | HOME
Close Window

Interactive Brokers (IBKR): Buy, Sell, or Hold Post Q3 Earnings?

IBKR Cover Image

Interactive Brokers currently trades at $65.51 and has been a dream stock for shareholders. It’s returned 368% since December 2020, blowing past the S&P 500’s 86.4% gain. The company has also beaten the index over the past six months as its stock price is up 27.8% thanks to its solid quarterly results.

Is there a buying opportunity in Interactive Brokers, or does it present a risk to your portfolio? Check out our in-depth research report to see what our analysts have to say, it’s free for active Edge members.

Why Is Interactive Brokers Not Exciting?

We’re glad investors have benefited from the price increase, but we don't have much confidence in Interactive Brokers. Here is one reason we avoid IBKR and a stock we'd rather own.

High Debt Levels Increase Risk

Interactive Brokers reported $5.13 billion of cash and $29.62 billion of debt on its balance sheet in the most recent quarter.

As investors in high-quality companies, we primarily focus on whether a company’s profits can support its debt.

Interactive Brokers Net Debt Position

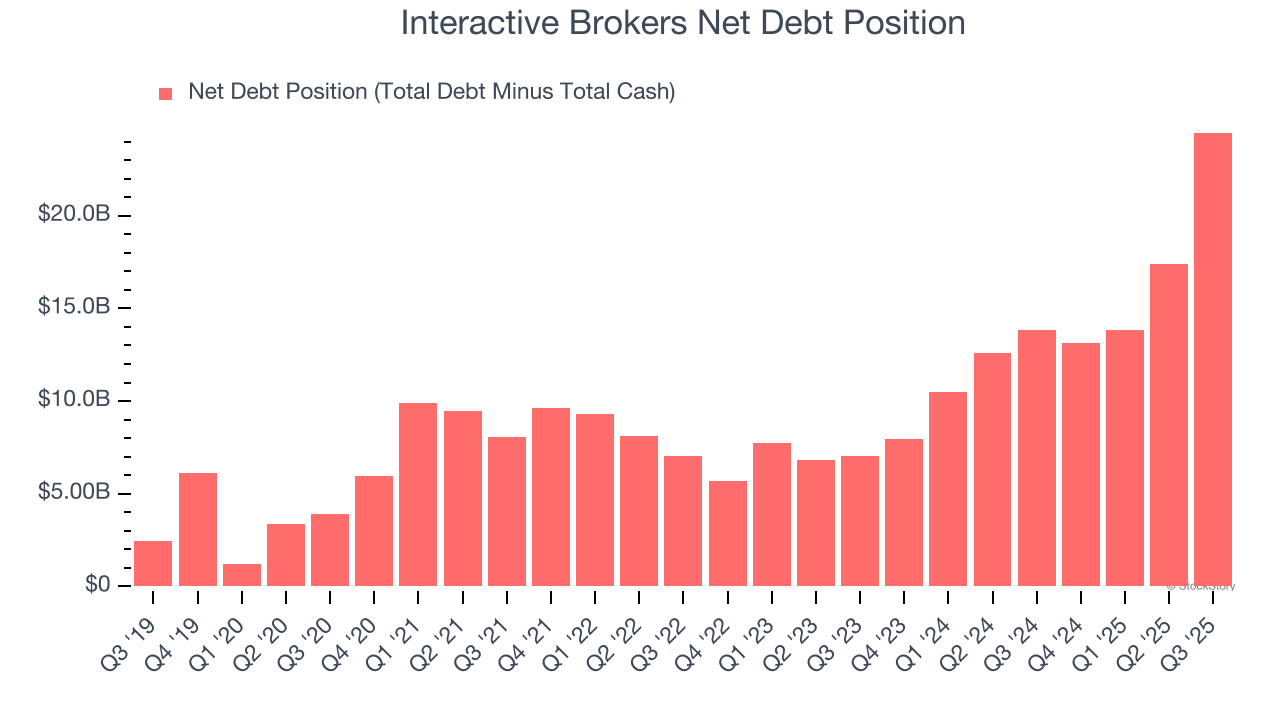
With $4.61 billion of EBITDA over the last 12 months, we view Interactive Brokers’s 5.3× net-debt-to-EBITDA ratio as inadequate. The company’s lacking profits relative to its borrowings give it little breathing room, raising red flags.

Final Judgment

Interactive Brokers isn’t a terrible business, but it isn’t one of our picks. With its shares outperforming the market lately, the stock trades at 28.9× forward P/E (or $65.51 per share). Investors with a higher risk tolerance might like the company, but we think the potential downside is too great. We're fairly confident there are better investments elsewhere. Let us point you toward a dominant Aerospace business that has perfected its M&A strategy.

High-Quality Stocks for All Market Conditions

If your portfolio success hinges on just 4 stocks, your wealth is built on fragile ground. You have a small window to secure high-quality assets before the market widens and these prices disappear.

Don’t wait for the next volatility shock. Check out our Top 6 Stocks for this week. This is a curated list of our High Quality stocks that have generated a market-beating return of 244% over the last five years (as of June 30, 2025).

Stocks that have made our list include now familiar names such as Nvidia (+1,326% between June 2020 and June 2025) as well as under-the-radar businesses like the once-small-cap company Exlservice (+354% five-year return). Find your next big winner with StockStory today.

StockStory is growing and hiring equity analyst and marketing roles. Are you a 0 to 1 builder passionate about the markets and AI? See the open roles here.

Recent Quotes

View More
Symbol Price Change (%)
AMZN  222.56
+0.00 (0.00%)
AAPL  274.61
+0.00 (0.00%)
AMD  209.17
+0.00 (0.00%)
BAC  54.81
+0.00 (0.00%)
GOOG  307.73
+0.00 (0.00%)
META  657.15
+0.00 (0.00%)
MSFT  476.39
+0.00 (0.00%)
NVDA  177.72
+0.00 (0.00%)
ORCL  188.65
+0.00 (0.00%)
TSLA  489.88
+0.00 (0.00%)
Stock Quote API & Stock News API supplied by www.cloudquote.io
Quotes delayed at least 20 minutes.
By accessing this page, you agree to the Privacy Policy and Terms Of Service.


IntelligentValue Home
Close Window

DISCLAIMER

All content herein is issued solely for informational purposes and is not to be construed as an offer to sell or the solicitation of an offer to buy, nor should it be interpreted as a recommendation to buy, hold or sell (short or otherwise) any security.  All opinions, analyses, and information included herein are based on sources believed to be reliable, but no representation or warranty of any kind, expressed or implied, is made including but not limited to any representation or warranty concerning accuracy, completeness, correctness, timeliness or appropriateness. We undertake no obligation to update such opinions, analysis or information. You should independently verify all information contained on this website. Some information is based on analysis of past performance or hypothetical performance results, which have inherent limitations. We make no representation that any particular equity or strategy will or is likely to achieve profits or losses similar to those shown. Shareholders, employees, writers, contractors, and affiliates associated with ETFOptimize.com may have ownership positions in the securities that are mentioned. If you are not sure if ETFs, algorithmic investing, or a particular investment is right for you, you are urged to consult with a Registered Investment Advisor (RIA). Neither this website nor anyone associated with producing its content are Registered Investment Advisors, and no attempt is made herein to substitute for personalized, professional investment advice. Neither ETFOptimize.com, Global Alpha Investments, Inc., nor its employees, service providers, associates, or affiliates are responsible for any investment losses you may incur as a result of using the information provided herein. Remember that past investment returns may not be indicative of future returns.

Copyright © 1998-2017 ETFOptimize.com, a publication of Optimized Investments, Inc. All rights reserved.