
MYR Group currently trades at $226.41 and has been a dream stock for shareholders. It’s returned 283% since December 2020, more than tripling the S&P 500’s 86.4% gain. The company has also beaten the index over the past six months as its stock price is up 38.6%.
Is there a buying opportunity in MYR Group, or does it present a risk to your portfolio? See what our analysts have to say in our full research report, it’s free for active Edge members.
Why Is MYR Group Not Exciting?
We’re happy investors have made money, but we're sitting this one out for now. Here are three reasons why MYRG doesn't excite us and a stock we'd rather own.
1. Backlog Declines as Orders Drop
We can better understand Construction and Maintenance Services companies by analyzing their backlog. This metric shows the value of outstanding orders that have not yet been executed or delivered, giving visibility into MYR Group’s future revenue streams.
MYR Group’s backlog came in at $2.34 billion in the latest quarter, and it averaged 4.3% year-on-year declines over the last two years. This performance was underwhelming and shows the company is not winning new orders. It also suggests there may be increasing competition or market saturation. 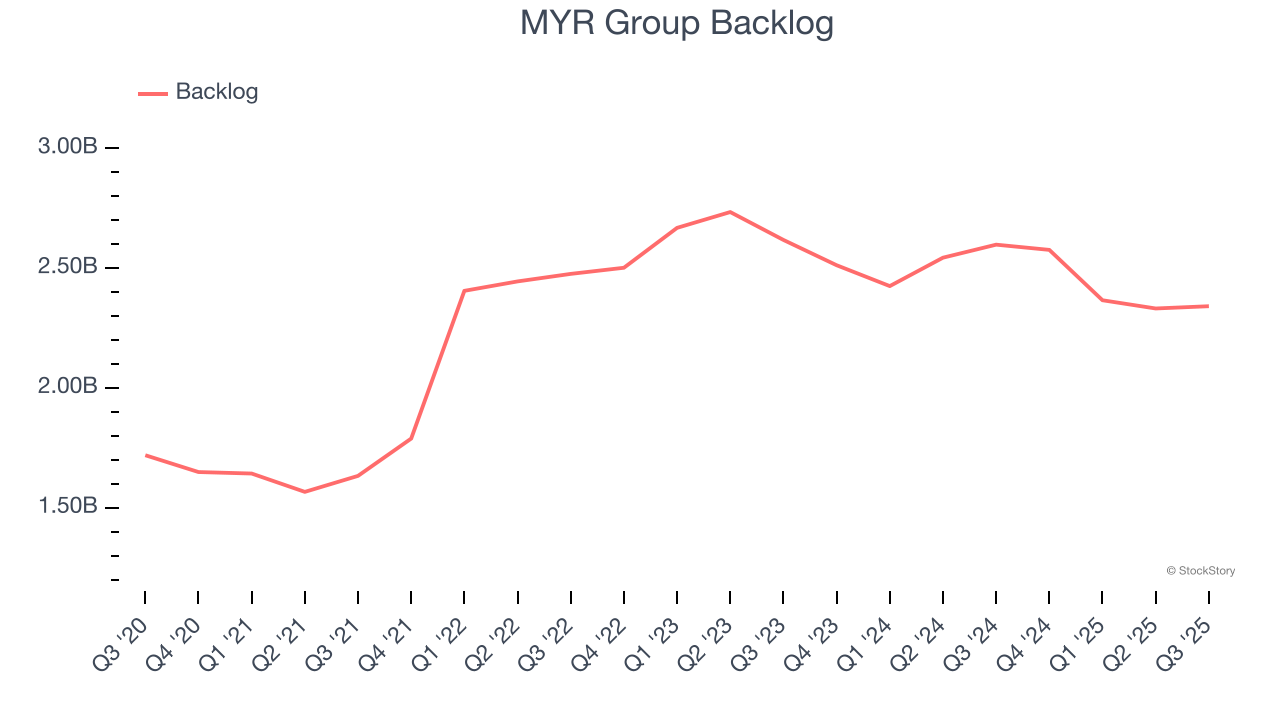
2. Low Gross Margin Reveals Weak Structural Profitability
All else equal, we prefer higher gross margins because they make it easier to generate more operating profits and indicate that a company commands pricing power by offering more differentiated products.
MYR Group has bad unit economics for an industrials business, signaling it operates in a competitive market. As you can see below, it averaged a 10.8% gross margin over the last five years. Said differently, MYR Group had to pay a chunky $89.16 to its suppliers for every $100 in revenue. 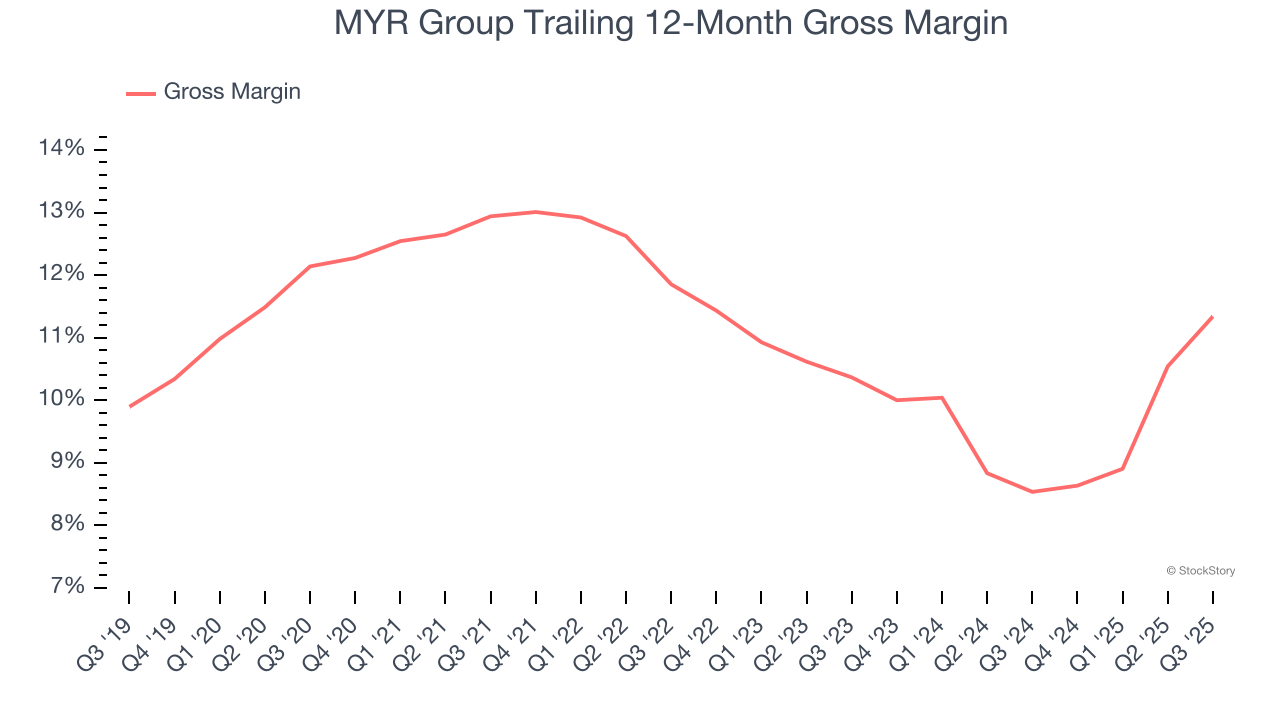
3. New Investments Fail to Bear Fruit as ROIC Declines
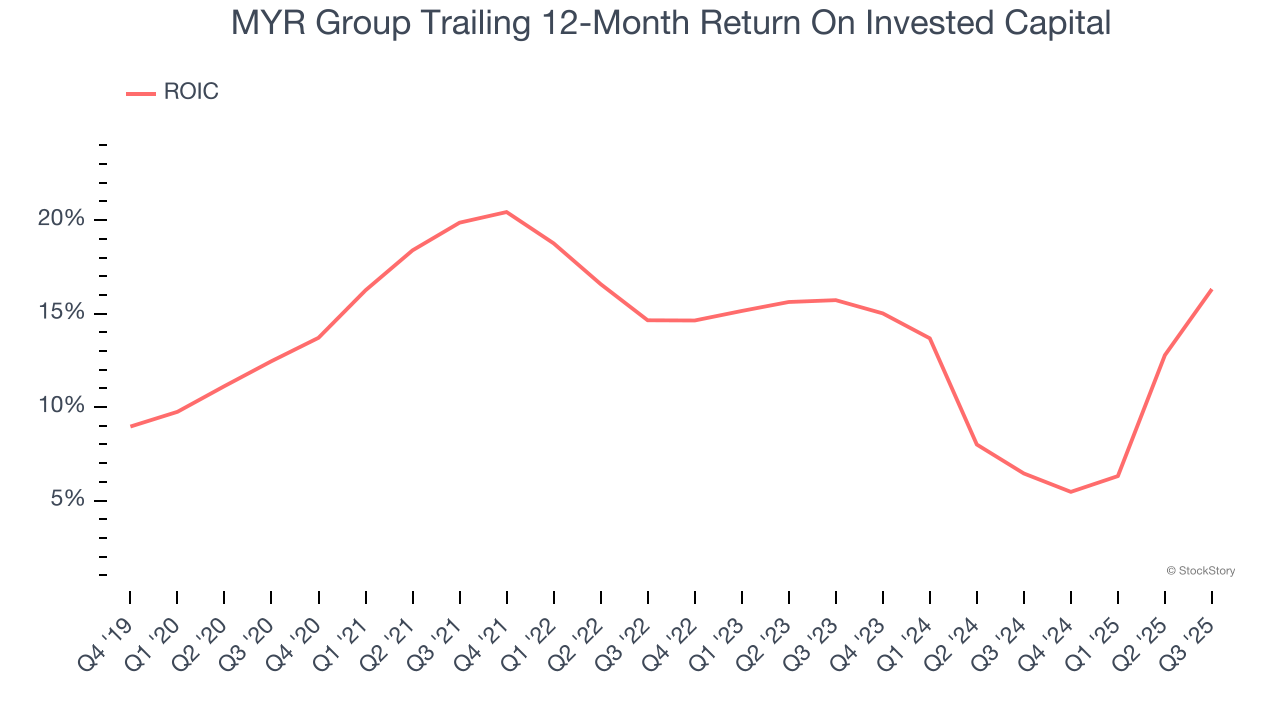
A company’s ROIC, or return on invested capital, shows how much operating profit it makes compared to the money it has raised (debt and equity).
We like to invest in businesses with high returns, but the trend in a company’s ROIC is what often surprises the market and moves the stock price. Unfortunately, MYR Group’s ROIC has decreased over the last few years. We like what management has done in the past, but its declining returns are perhaps a symptom of fewer profitable growth opportunities.
Final Judgment
MYR Group isn’t a terrible business, but it isn’t one of our picks. With its shares outperforming the market lately, the stock trades at 27.3× forward P/E (or $226.41 per share). Beauty is in the eye of the beholder, but we don’t really see a big opportunity at the moment. We're pretty confident there are superior stocks to buy right now. We’d recommend looking at the most dominant software business in the world.
Stocks We Like More Than MYR Group
Your portfolio can’t afford to be based on yesterday’s story. The risk in a handful of heavily crowded stocks is rising daily.
The names generating the next wave of massive growth are right here in our Top 6 Stocks for this week. This is a curated list of our High Quality stocks that have generated a market-beating return of 244% over the last five years (as of June 30, 2025).
Stocks that have made our list include now familiar names such as Nvidia (+1,326% between June 2020 and June 2025) as well as under-the-radar businesses like the once-micro-cap company Tecnoglass (+1,754% five-year return). Find your next big winner with StockStory today.
StockStory is growing and hiring equity analyst and marketing roles. Are you a 0 to 1 builder passionate about the markets and AI? See the open roles here.


