
Moody's currently trades at $479.90 per share and has shown little upside over the past six months, posting a small loss of 0.8%. The stock also fell short of the S&P 500’s 13.6% gain during that period.
Is now the time to buy MCO? Find out in our full research report, it’s free for active Edge members.
Why Are We Positive On Moody's?
Founded in 1900 during America's railroad boom when investors needed reliable information on bond risks, Moody's (NYSE: MCO) provides credit ratings, risk assessment tools, and analytical solutions that help organizations evaluate financial risks and make informed investment decisions.
1. Encouraging Short-Term Revenue Growth
Long-term growth is the most important, but within financials, a stretched historical view may miss recent interest rate changes and market returns. Moody’s annualized revenue growth of 14.5% over the last two years is above its five-year trend, suggesting its demand recently accelerated. 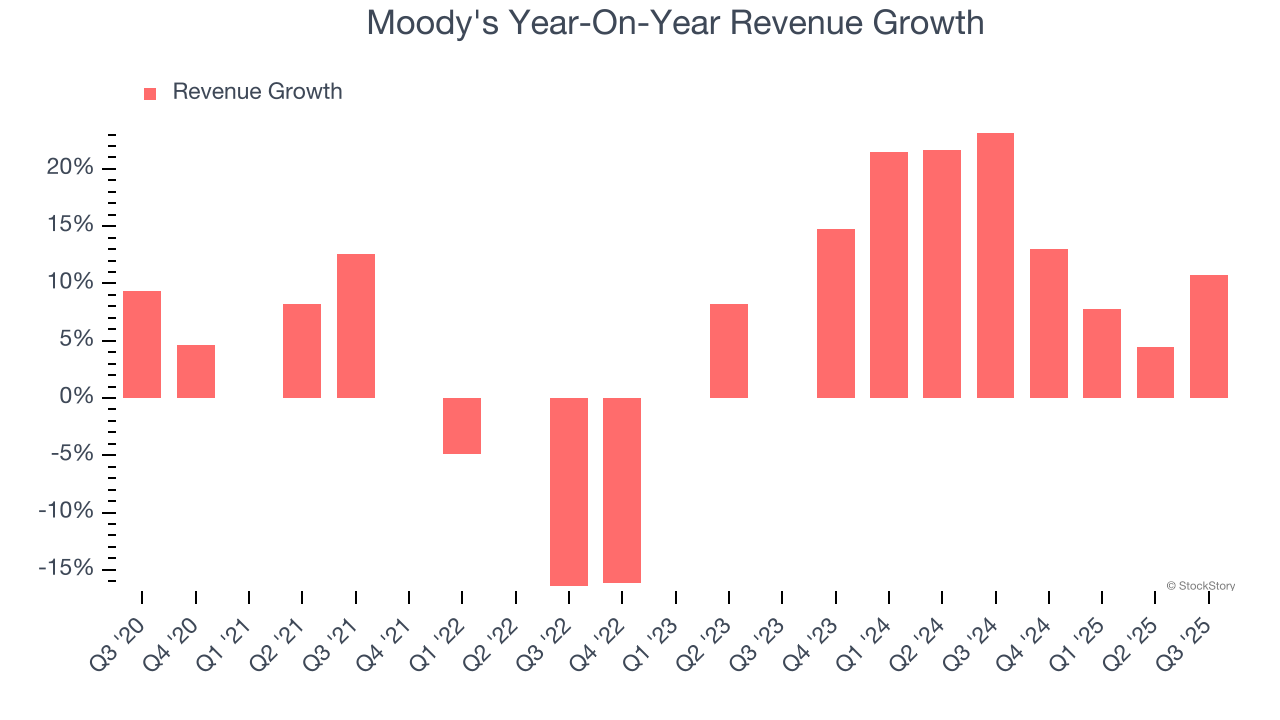 Note: Quarters not shown were determined to be outliers, impacted by outsized investment gains/losses that are not indicative of the recurring fundamentals of the business.
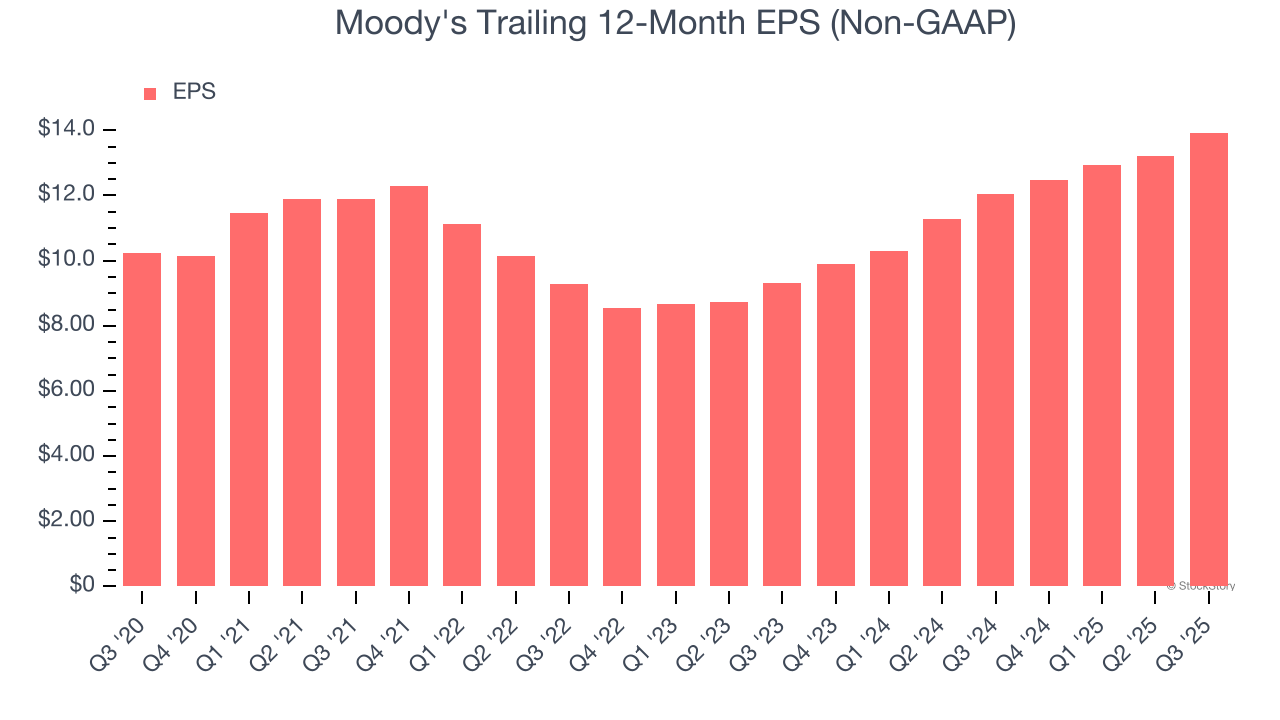
2. EPS Surges Higher Over the Last Two Years
While long-term earnings trends give us the big picture, we also track EPS over a shorter period because it can provide insight into an emerging theme or development for the business.
Moody’s EPS grew at a spectacular 22.3% compounded annual growth rate over the last two years, higher than its 14.5% annualized revenue growth. This tells us the company became more profitable on a per-share basis as it expanded.
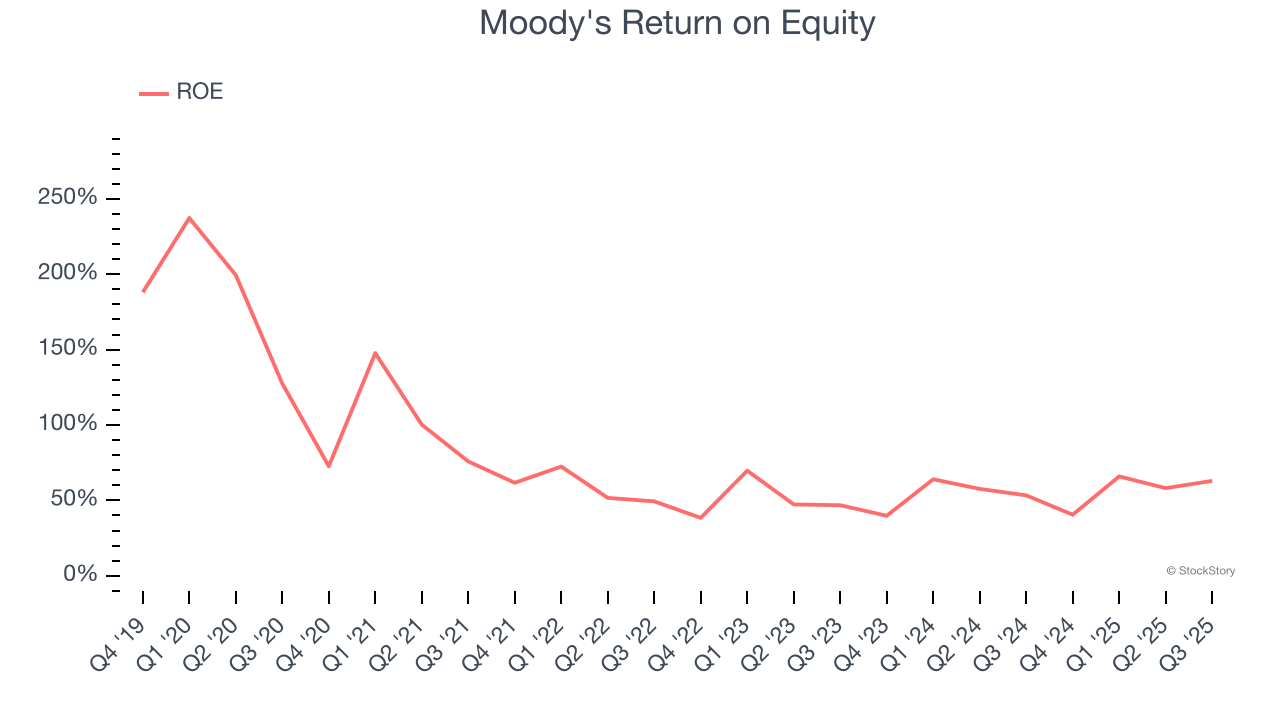
3. Stellar ROE Showcases Lucrative Growth Opportunities
Return on equity (ROE) measures how effectively banks generate profit from each dollar of shareholder equity - a critical funding source. High-ROE institutions typically compound shareholder wealth faster over time through retained earnings, share repurchases, and dividend payments.
Over the last five years, Moody's has averaged an ROE of 63.8%, exceptional for a company operating in a sector where the average shakes out around 10% and those putting up 25%+ are greatly admired. This shows Moody's has a strong competitive moat.
Final Judgment
These are just a few reasons why we're bullish on Moody's. With its shares underperforming the market lately, the stock trades at 30.4× forward P/E (or $479.90 per share). Is now the time to initiate a position? See for yourself in our comprehensive research report, it’s free for active Edge members .
Stocks We Like Even More Than Moody's
If your portfolio success hinges on just 4 stocks, your wealth is built on fragile ground. You have a small window to secure high-quality assets before the market widens and these prices disappear.
Don’t wait for the next volatility shock. Check out our Top 5 Strong Momentum Stocks for this week. This is a curated list of our High Quality stocks that have generated a market-beating return of 244% over the last five years (as of June 30, 2025).
Stocks that have made our list include now familiar names such as Nvidia (+1,326% between June 2020 and June 2025) as well as under-the-radar businesses like the once-small-cap company Exlservice (+354% five-year return). Find your next big winner with StockStory today.
StockStory is growing and hiring equity analyst and marketing roles. Are you a 0 to 1 builder passionate about the markets and AI? See the open roles here.


