Cadence Design Systems has followed the market’s trajectory closely, rising in tandem with the S&P 500 over the past six months. The stock has climbed by 11% to $340.92 per share while the index has gained 13.6%.
Is CDNS a buy right now? Find out in our full research report, it’s free for active Edge members.
Why Does CDNS Stock Spark Debate?
Powering the chips behind everything from smartphones to AI accelerators for over 35 years, Cadence Design Systems (NASDAQ: CDNS) provides essential computational software, hardware, and intellectual property used by engineers to design and verify advanced electronic systems and semiconductors.
Two Positive Attributes:
1. Billings Surge, Boosting Cash On Hand
Billings is a non-GAAP metric that is often called “cash revenue” because it shows how much money the company has collected from customers in a certain period. This is different from revenue, which must be recognized in pieces over the length of a contract.
Cadence Design Systems’s billings punched in at $1.36 billion in Q3, and over the last four quarters, its year-on-year growth averaged 21.8%. This performance was impressive, indicating robust customer demand. The high level of cash collected from customers also enhances liquidity and provides a solid foundation for future investments and growth. 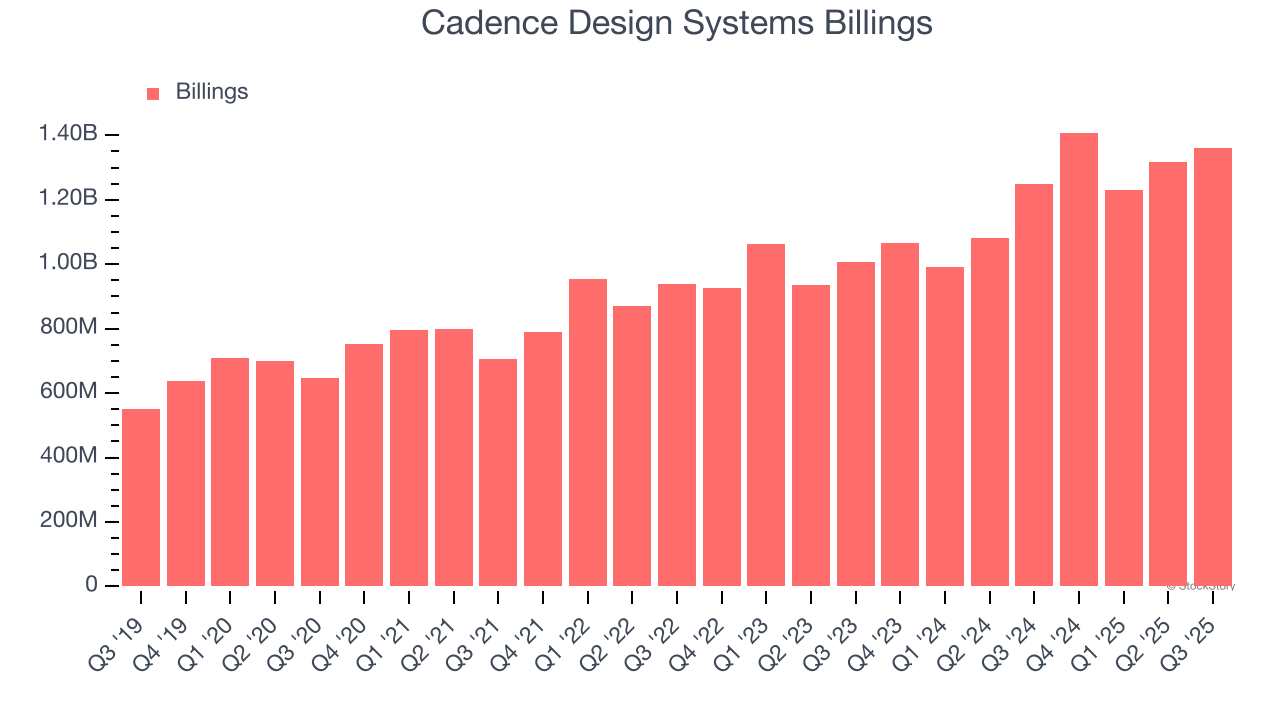
2. Customer Acquisition Costs Are Recovered in Record Time
The customer acquisition cost (CAC) payback period measures the months a company needs to recoup the money spent on acquiring a new customer. This metric helps assess how quickly a business can break even on its sales and marketing investments.
Cadence Design Systems is extremely efficient at acquiring new customers, and its CAC payback period checked in at 7.7 months this quarter. The company’s rapid recovery of its customer acquisition costs indicates it has a highly differentiated product offering and a strong brand reputation. These dynamics give Cadence Design Systems more resources to pursue new product initiatives while maintaining the flexibility to increase its sales and marketing investments.
One Reason to be Careful:
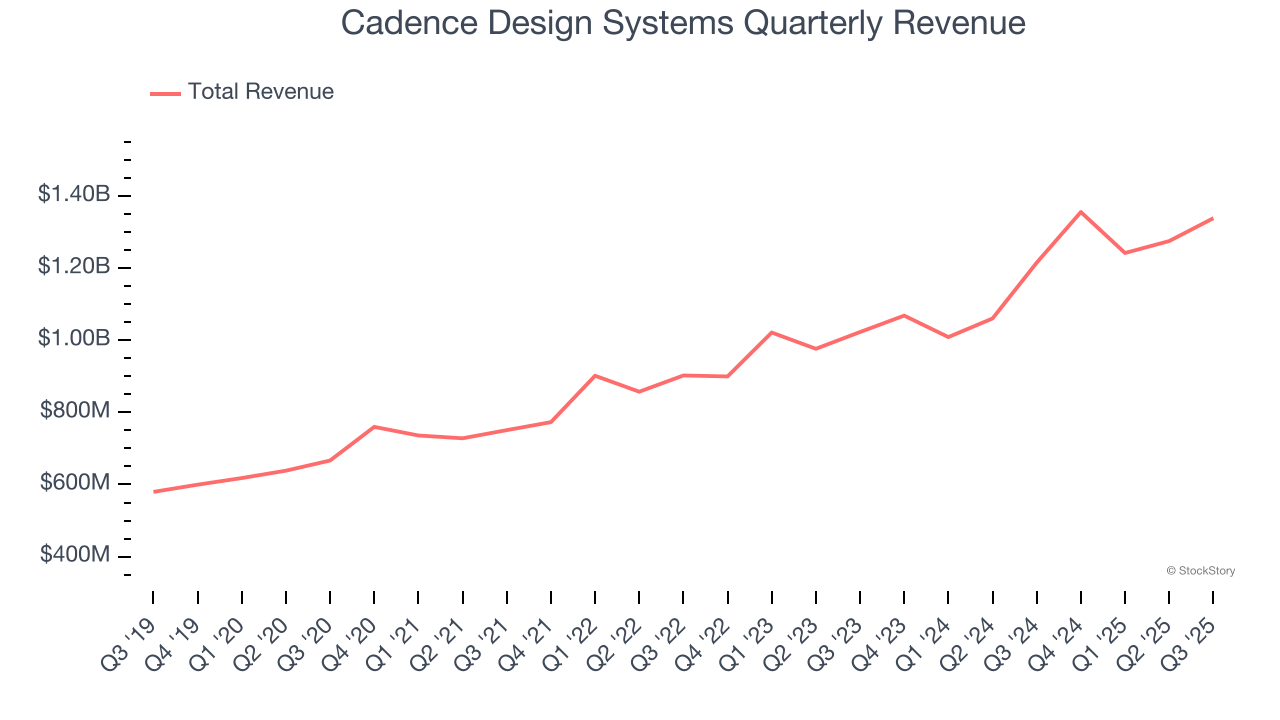
Long-Term Revenue Growth Disappoints
A company’s long-term sales performance can indicate its overall quality. Any business can have short-term success, but a top-tier one grows for years. Over the last five years, Cadence Design Systems grew its sales at a 15.6% annual rate. Although this growth is acceptable on an absolute basis, it fell slightly short of our standards for the software sector, which enjoys a number of secular tailwinds. Luckily, there are other things to like about Cadence Design Systems.
Final Judgment
Cadence Design Systems’s positive characteristics outweigh the negatives, but at $340.92 per share (or 16× forward price-to-sales), is now the right time to buy the stock? See for yourself in our in-depth research report, it’s free for active Edge members.
Stocks We Like Even More Than Cadence Design Systems
Your portfolio can’t afford to be based on yesterday’s story. The risk in a handful of heavily crowded stocks is rising daily.
The names generating the next wave of massive growth are right here in our Top 5 Strong Momentum Stocks for this week. This is a curated list of our High Quality stocks that have generated a market-beating return of 244% over the last five years (as of June 30, 2025).
Stocks that have made our list include now familiar names such as Nvidia (+1,326% between June 2020 and June 2025) as well as under-the-radar businesses like the once-small-cap company Exlservice (+354% five-year return). Find your next big winner with StockStory today.
StockStory is growing and hiring equity analyst and marketing roles. Are you a 0 to 1 builder passionate about the markets and AI? See the open roles here.


