Membership-only discount retailer Costco (NASDAQ: COST) met Wall Streets revenue expectations in Q4 CY2025, with sales up 8.3% year on year to $67.31 billion. Its GAAP profit of $4.50 per share was 5.2% above analysts’ consensus estimates.
Is now the time to buy Costco? Find out by accessing our full research report, it’s free for active Edge members.
Costco (COST) Q4 CY2025 Highlights:
- Revenue: $67.31 billion vs analyst estimates of $67.03 billion (8.3% year-on-year growth, in line)
- EPS (GAAP): $4.50 vs analyst estimates of $4.28 (5.2% beat)
- Adjusted EBITDA: $3.06 billion vs analyst estimates of $3.07 billion (4.5% margin, in line)
- Operating Margin: 3.7%, in line with the same quarter last year
- Free Cash Flow Margin: 4.7%, up from 3.2% in the same quarter last year
- Locations: 923 at quarter end, up from 896 in the same quarter last year
- Same-Store Sales rose 6.4% year on year (5.2% in the same quarter last year)
- Market Capitalization: $388.2 billion
Company Overview
Designed to be a one-stop shop for the suburban consumer, Costco (NASDAQ: COST) is a membership-only retail chain that sells groceries, apparel, toys, and household items, often in bulk quantities.
Revenue Growth
A company’s long-term sales performance is one signal of its overall quality. Even a bad business can shine for one or two quarters, but a top-tier one grows for years.
With $280.4 billion in revenue over the past 12 months, Costco is a behemoth in the consumer retail sector and benefits from economies of scale, giving it an edge in distribution. This also enables it to gain more leverage on its fixed costs than smaller competitors and the flexibility to offer lower prices. However, its scale is a double-edged sword because there is only so much real estate to build new stores, placing a ceiling on its growth. For Costco to boost its sales, it likely needs to adjust its prices or lean into foreign markets.
As you can see below, Costco’s 6.7% annualized revenue growth over the last three years (we compare to 2019 to normalize for COVID-19 impacts) was tepid, but to its credit, it opened new stores and increased sales at existing, established locations.
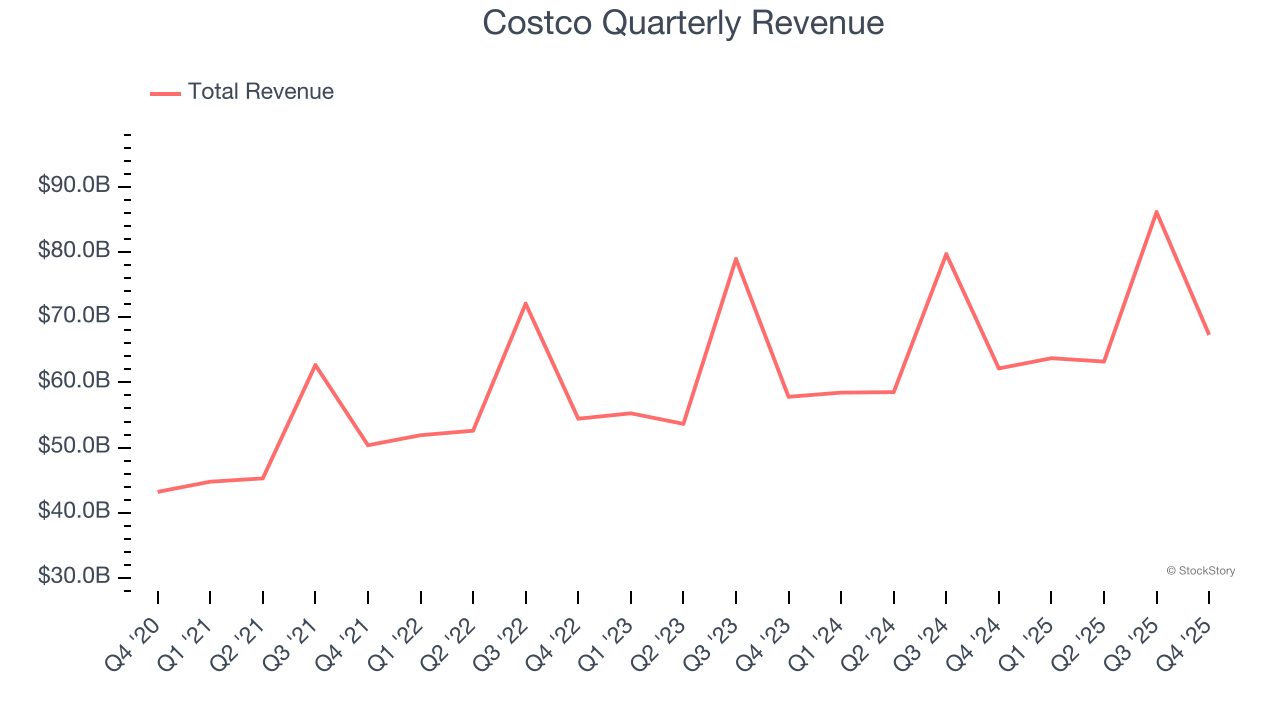
This quarter, Costco grew its revenue by 8.3% year on year, and its $67.31 billion of revenue was in line with Wall Street’s estimates.
Looking ahead, sell-side analysts expect revenue to grow 7.6% over the next 12 months, similar to its three-year rate. This projection is particularly healthy for a company of its scale and indicates the market sees success for its products.
While Wall Street chases Nvidia at all-time highs, an under-the-radar semiconductor supplier is dominating a critical AI component these giants can’t build without. Click here to access our free report one of our favorites growth stories.
Store Performance
Number of Stores
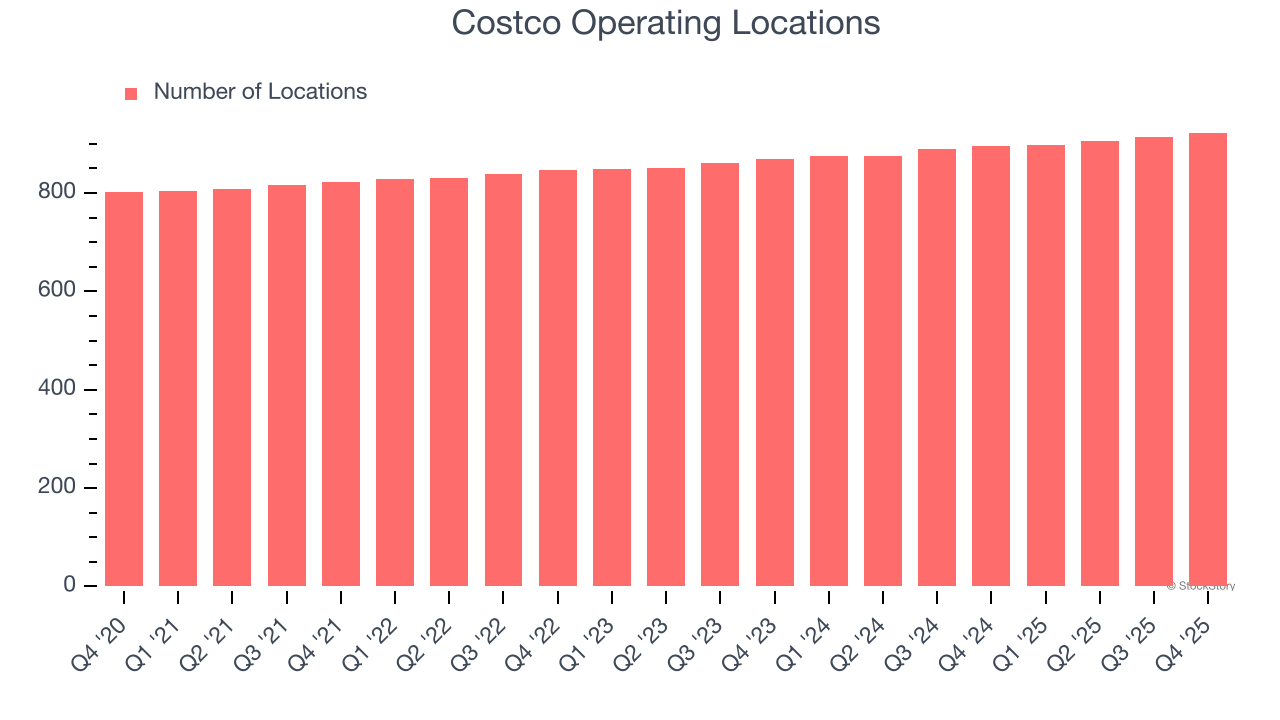
Costco operated 923 locations in the latest quarter. It has opened new stores quickly over the last two years, averaging 3% annual growth, faster than the broader consumer retail sector.
When a retailer opens new stores, it usually means it’s investing for growth because demand is greater than supply, especially in areas where consumers may not have a store within reasonable driving distance.
Same-Store Sales
A company's store base only paints one part of the picture. When demand is high, it makes sense to open more. But when demand is low, it’s prudent to close some locations and use the money in other ways. Same-store sales provides a deeper understanding of this issue because it measures organic growth at brick-and-mortar shops for at least a year.
Costco has been one of the most successful retailers over the last two years thanks to skyrocketing demand within its existing locations. On average, the company has posted exceptional year-on-year same-store sales growth of 5.9%. This performance suggests its rollout of new stores is beneficial for shareholders. We like this backdrop because it gives Costco multiple ways to win: revenue growth can come from new stores, e-commerce, or increased foot traffic and higher sales per customer at existing locations.
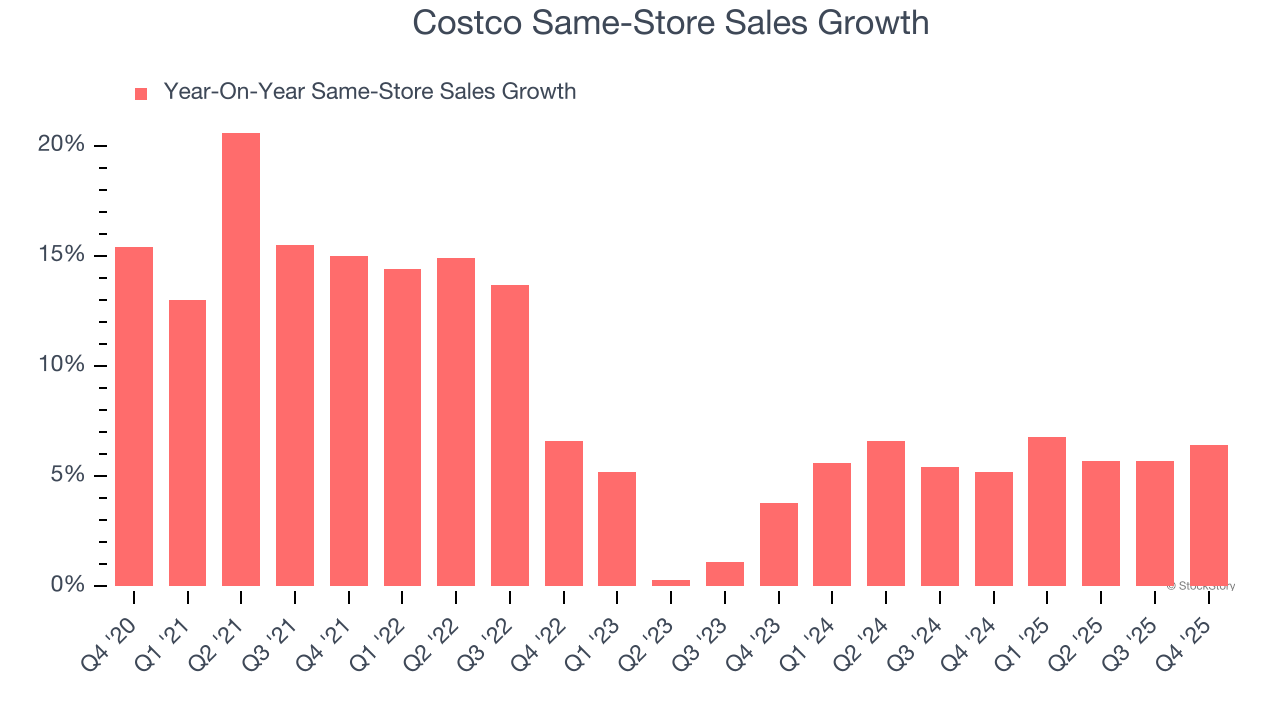
In the latest quarter, Costco’s same-store sales rose 6.4% year on year. This performance was more or less in line with its historical levels.
Key Takeaways from Costco’s Q4 Results
We were impressed by how significantly Costco blew past analysts’ gross margin expectations this quarter. We were also glad its EPS outperformed Wall Street’s estimates. Overall, this print had some key positives. The stock remained flat at $879.25 immediately following the results.
Is Costco an attractive investment opportunity at the current price? We think that the latest quarter is only one piece of the longer-term business quality puzzle. Quality, when combined with valuation, can help determine if the stock is a buy. We cover that in our actionable full research report which you can read here, it’s free for active Edge members.


