
CSX trades at $37.04 and has moved in lockstep with the market. Its shares have returned 14.6% over the last six months while the S&P 500 has gained 13.6%.
Is there a buying opportunity in CSX, or does it present a risk to your portfolio? Get the full breakdown from our expert analysts, it’s free for active Edge members.
Why Do We Think CSX Will Underperform?
We're swiping left on CSX for now. Here are three reasons we avoid CSX and a stock we'd rather own.
1. Weak Sales Volumes Indicate Waning Demand
Revenue growth can be broken down into changes in price and volume (the number of units sold). While both are important, volume is the lifeblood of a successful Rail Transportation company because there’s a ceiling to what customers will pay.
CSX’s units sold came in at 1.61 million in the latest quarter, and over the last two years, averaged 1.3% year-on-year growth. This performance was underwhelming and suggests it might have to lower prices or invest in product improvements to accelerate growth, factors that can hinder near-term profitability. 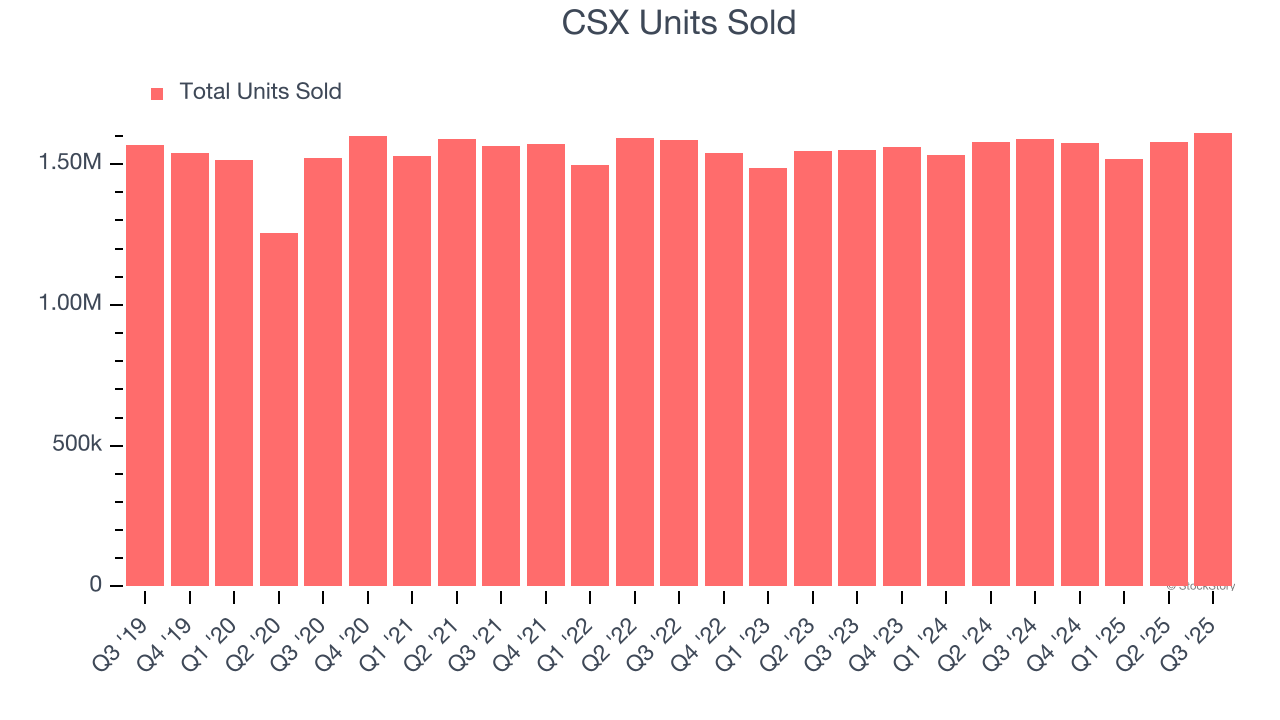
2. EPS Barely Growing
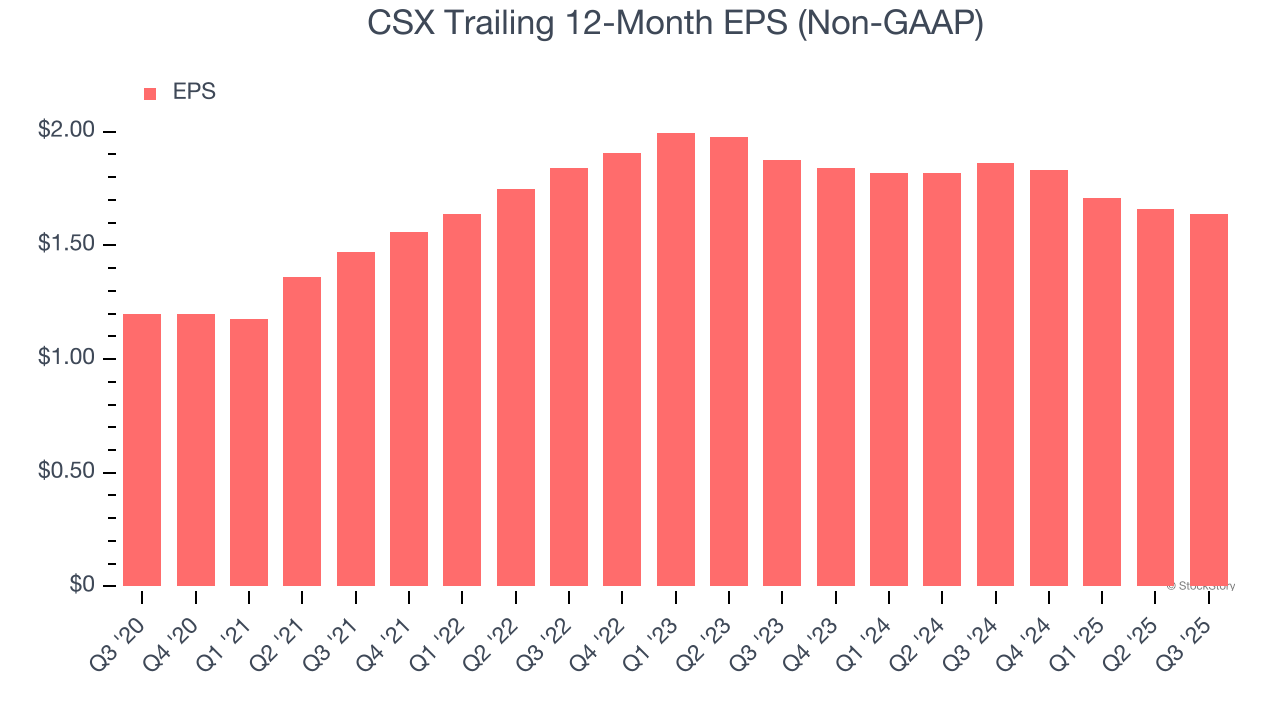
Analyzing the long-term change in earnings per share (EPS) shows whether a company's incremental sales were profitable – for example, revenue could be inflated through excessive spending on advertising and promotions.
CSX’s unimpressive 6.4% annual EPS growth over the last five years aligns with its revenue performance. This tells us it maintained its per-share profitability as it expanded.
3. Free Cash Flow Margin Dropping
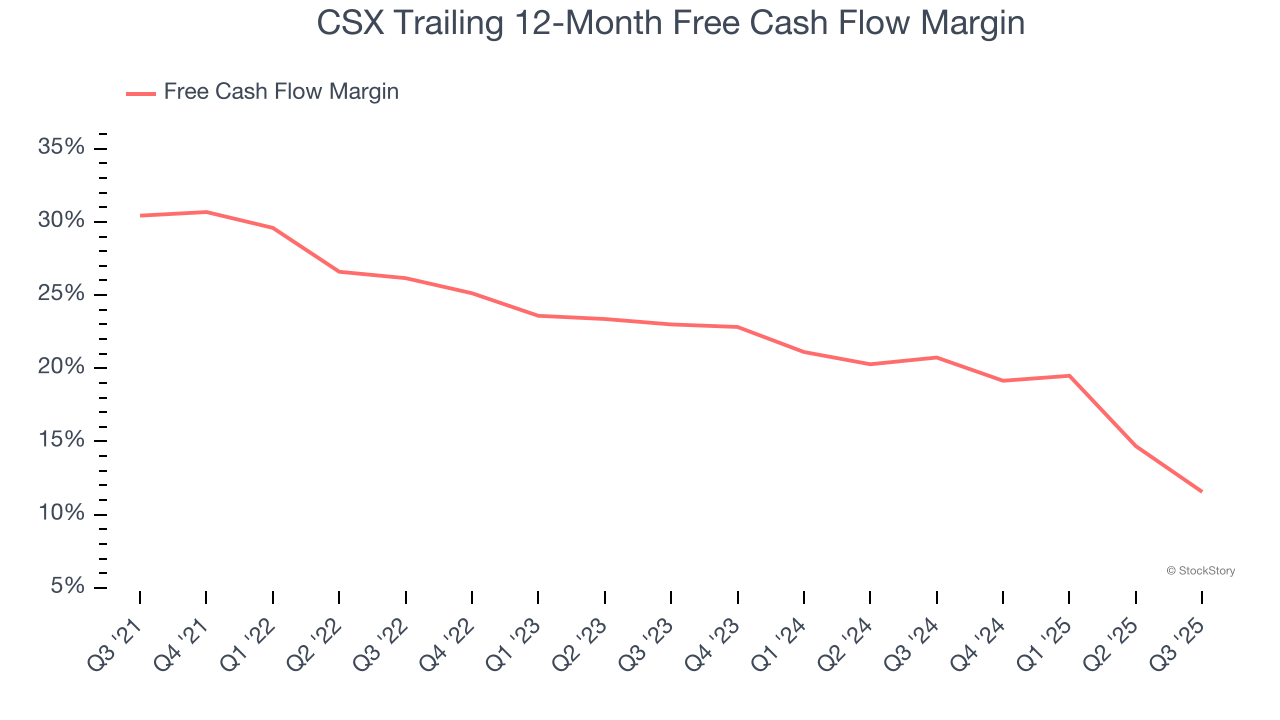
If you’ve followed StockStory for a while, you know we emphasize free cash flow. Why, you ask? We believe that in the end, cash is king, and you can’t use accounting profits to pay the bills.
As you can see below, CSX’s margin dropped by 18.9 percentage points over the last five years. If its declines continue, it could signal increasing investment needs and capital intensity. CSX’s free cash flow margin for the trailing 12 months was 11.6%.
Final Judgment
We see the value of companies helping their customers, but in the case of CSX, we’re out. That said, the stock currently trades at 19.7× forward P/E (or $37.04 per share). While this valuation is fair, the upside isn’t great compared to the potential downside. There are more exciting stocks to buy at the moment. We’d recommend looking at the most dominant software business in the world.
High-Quality Stocks for All Market Conditions
If your portfolio success hinges on just 4 stocks, your wealth is built on fragile ground. You have a small window to secure high-quality assets before the market widens and these prices disappear.
Don’t wait for the next volatility shock. Check out our Top 5 Growth Stocks for this month. This is a curated list of our High Quality stocks that have generated a market-beating return of 244% over the last five years (as of June 30, 2025).
Stocks that have made our list include now familiar names such as Nvidia (+1,326% between June 2020 and June 2025) as well as under-the-radar businesses like the once-micro-cap company Tecnoglass (+1,754% five-year return). Find your next big winner with StockStory today.
StockStory is growing and hiring equity analyst and marketing roles. Are you a 0 to 1 builder passionate about the markets and AI? See the open roles here.


