
Federated Hermes’s 21.3% return over the past six months has outpaced the S&P 500 by 7.7%, and its stock price has climbed to $51.38 per share. This was partly due to its solid quarterly results, and the performance may have investors wondering how to approach the situation.
Is it too late to buy FHI? Find out in our full research report, it’s free for active Edge members.
Why Does FHI Stock Spark Debate?
With roots dating back to 1955 and a pioneering role in money market funds, Federated Hermes (NYSE: FHI) is an investment management firm that offers a wide range of funds and strategies for institutional and individual investors.
Two Positive Attributes:
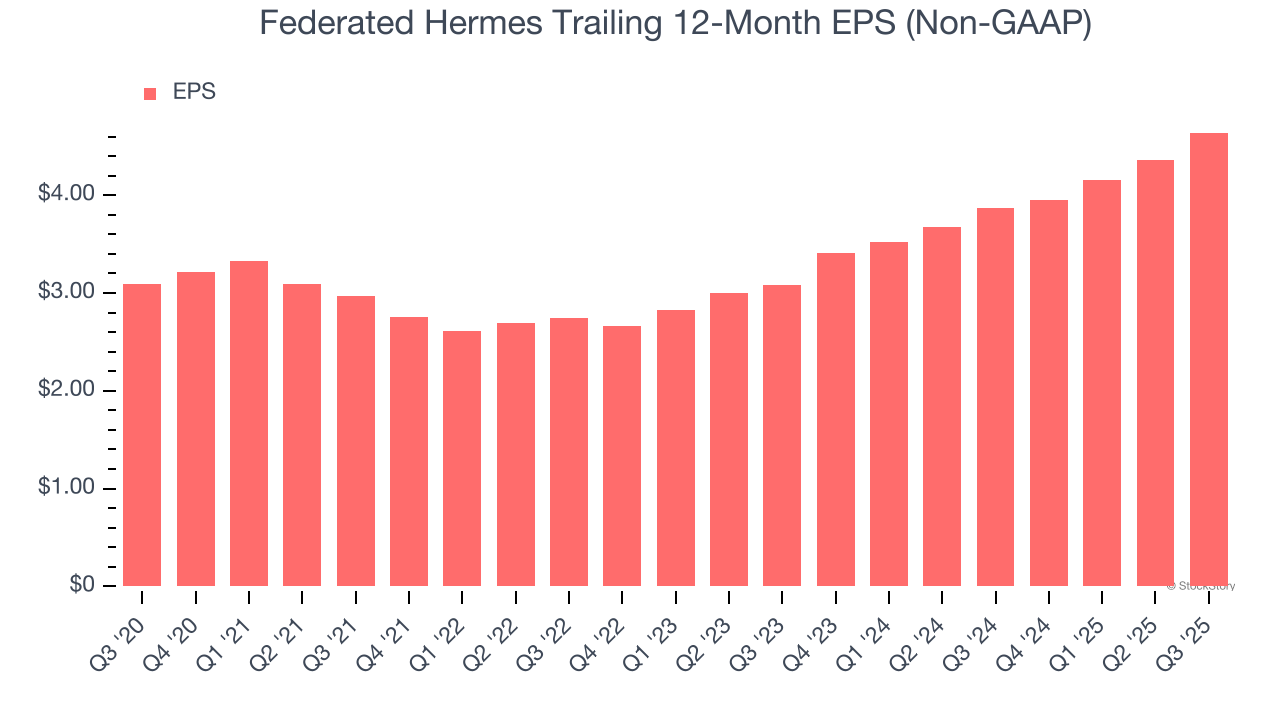
1. EPS Surges Higher Over the Last Two Years
Although long-term earnings trends give us the big picture, we like to analyze EPS over a shorter period to see if we are missing a change in the business.
Federated Hermes’s EPS grew at a spectacular 22.7% compounded annual growth rate over the last two years, higher than its 4.6% annualized revenue growth. This tells us the company became more profitable on a per-share basis as it expanded.
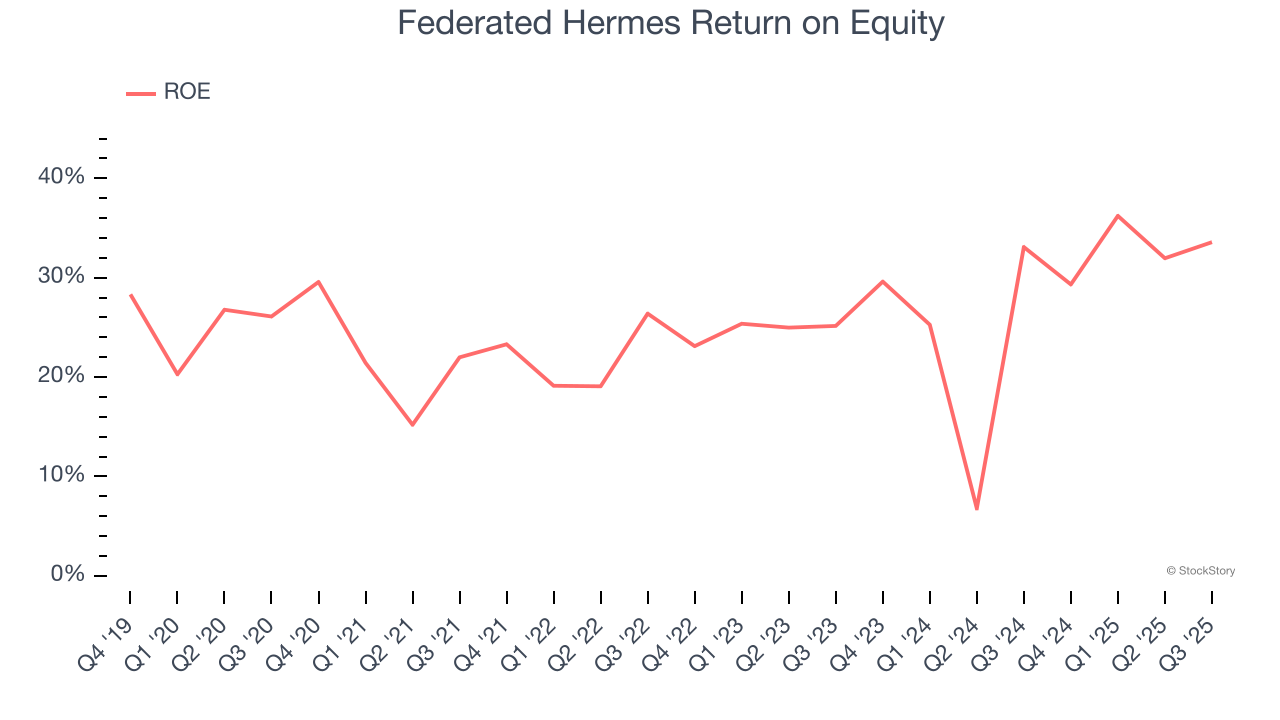
2. Stellar ROE Showcases Lucrative Growth Opportunities
Return on equity, or ROE, tells us how much profit a company generates for each dollar of shareholder equity, a key funding source for banks. Over a long period, banks with high ROE tend to compound shareholder wealth faster through retained earnings, buybacks, and dividends.
Over the last five years, Federated Hermes has averaged an ROE of 25%, exceptional for a company operating in a sector where the average shakes out around 10% and those putting up 25%+ are greatly admired. This shows Federated Hermes has a strong competitive moat.
One Reason to be Careful:
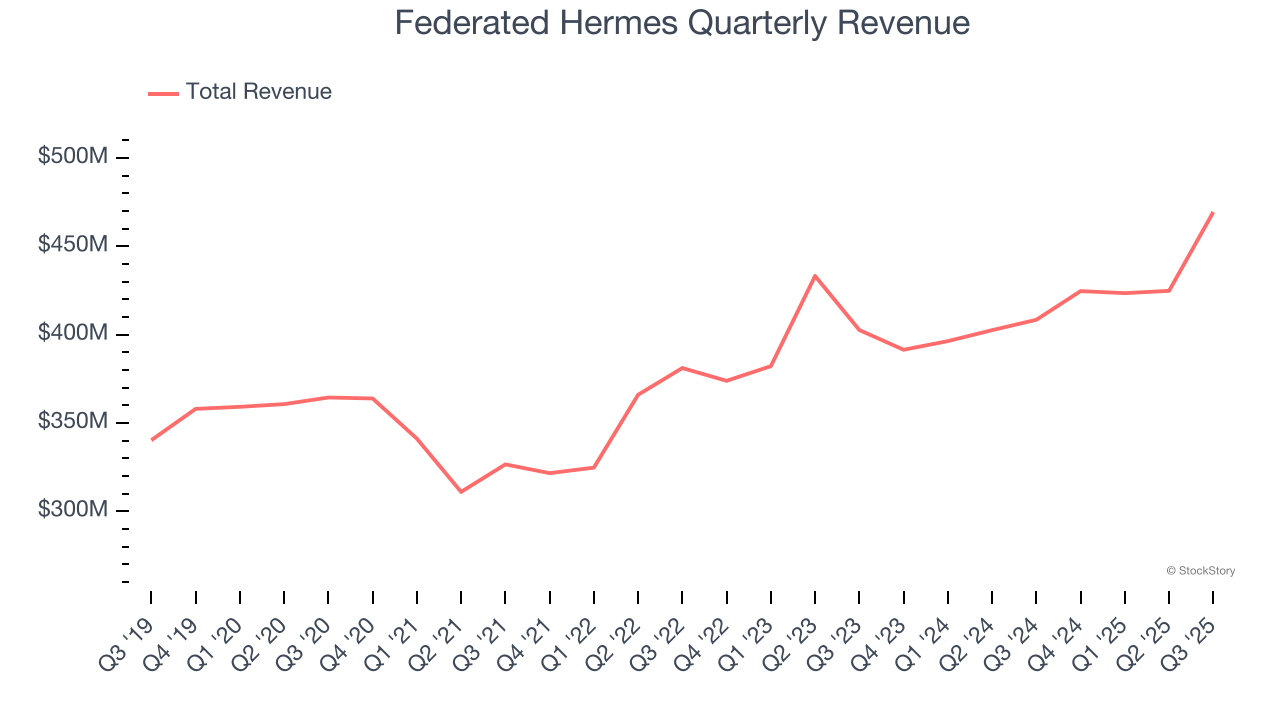
Long-Term Revenue Growth Disappoints
Examining a company’s long-term performance can provide clues about its quality. Even a bad business can shine for one or two quarters, but a top-tier one grows for years.
Unfortunately, Federated Hermes’s 3.9% annualized revenue growth over the last five years was sluggish. This wasn’t a great result compared to the rest of the financials sector, but there are still things to like about Federated Hermes.
Final Judgment
Federated Hermes has huge potential even though it has some open questions, and with its shares beating the market recently, the stock trades at 10.2× forward P/E (or $51.38 per share). Is now the time to initiate a position? See for yourself in our full research report, it’s free for active Edge members.
Stocks We Like Even More Than Federated Hermes
Your portfolio can’t afford to be based on yesterday’s story. The risk in a handful of heavily crowded stocks is rising daily.
The names generating the next wave of massive growth are right here in our Top 5 Strong Momentum Stocks for this week. This is a curated list of our High Quality stocks that have generated a market-beating return of 244% over the last five years (as of June 30, 2025).
Stocks that have made our list include now familiar names such as Nvidia (+1,326% between June 2020 and June 2025) as well as under-the-radar businesses like the once-small-cap company Comfort Systems (+782% five-year return). Find your next big winner with StockStory today.
StockStory is growing and hiring equity analyst and marketing roles. Are you a 0 to 1 builder passionate about the markets and AI? See the open roles here.


