
What a time it’s been for Krispy Kreme. In the past six months alone, the company’s stock price has increased by a massive 67.1%, reaching $4.68 per share. This was partly thanks to its solid quarterly results, and the run-up might have investors contemplating their next move.
Is there a buying opportunity in Krispy Kreme, or does it present a risk to your portfolio? Check out our in-depth research report to see what our analysts have to say, it’s free for active Edge members.
Why Do We Think Krispy Kreme Will Underperform?
Despite the momentum, we're cautious about Krispy Kreme. Here are three reasons there are better opportunities than DNUT and a stock we'd rather own.
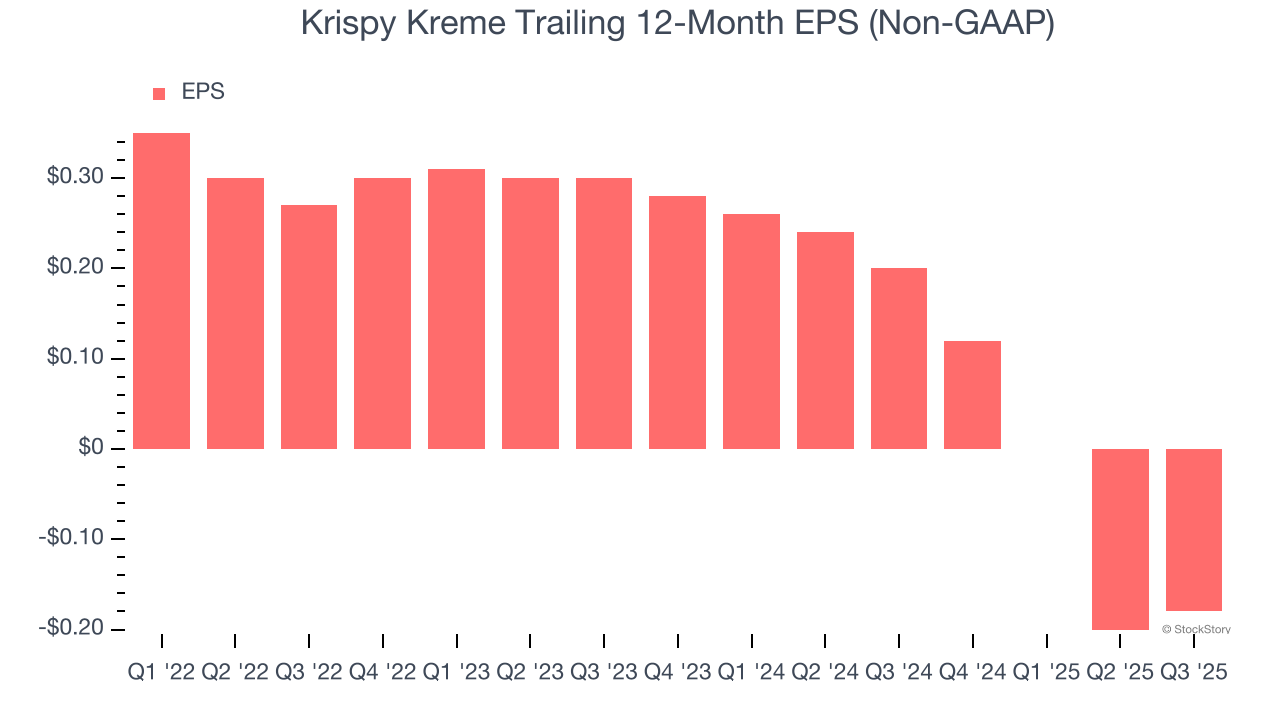
1. EPS Trending Down
Analyzing the long-term change in earnings per share (EPS) shows whether a company's incremental sales were profitable – for example, revenue could be inflated through excessive spending on advertising and promotions.
Krispy Kreme’s full-year EPS turned negative over the last four years. We tend to steer our readers away from companies with falling EPS, especially restaurants, which are arguably some of the hardest businesses to manage because of constantly changing consumer tastes, input costs, and labor dynamics. If the tide turns unexpectedly, Krispy Kreme’s low margin of safety could leave its stock price susceptible to large downswings.
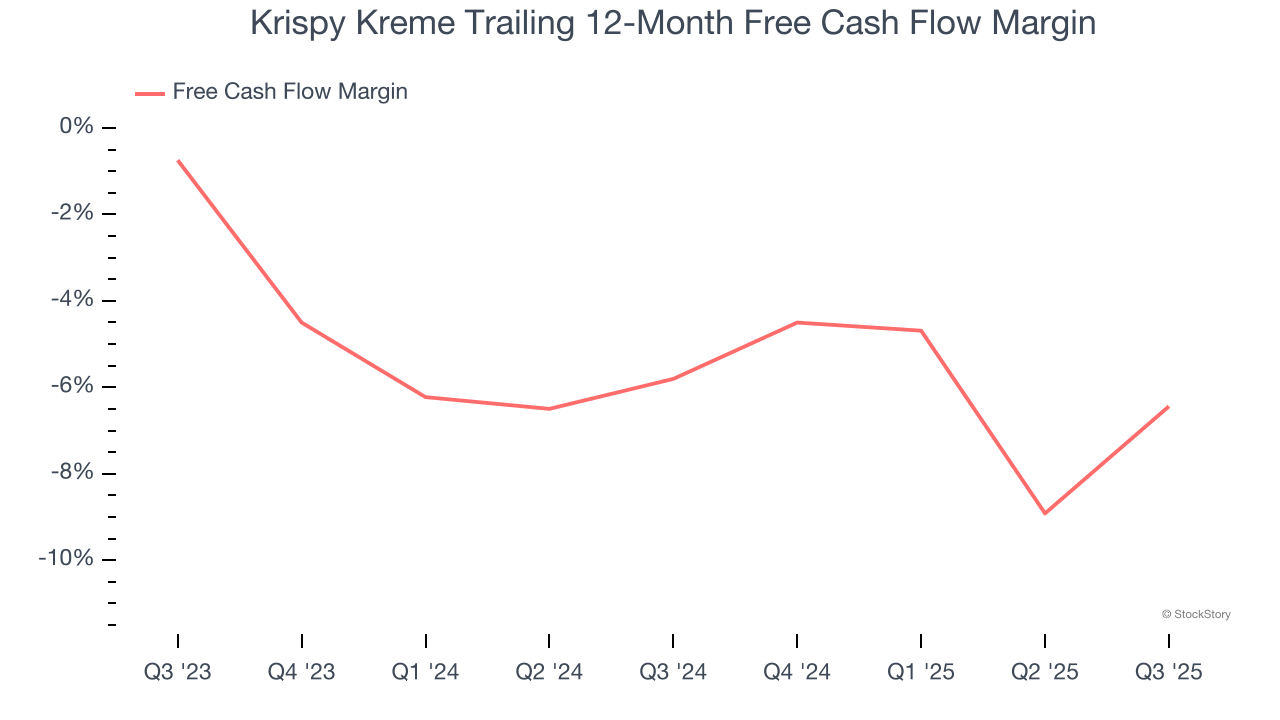
2. Cash Burn Ignites Concerns
If you’ve followed StockStory for a while, you know we emphasize free cash flow. Why, you ask? We believe that in the end, cash is king, and you can’t use accounting profits to pay the bills.
While Krispy Kreme posted positive free cash flow this quarter, the broader story hasn’t been so clean. Over the last two years, Krispy Kreme’s capital-intensive business model and large investments in new physical locations have drained its resources, putting it in a pinch and limiting its ability to return capital to investors. Its free cash flow margin averaged negative 6.1%, meaning it lit $6.11 of cash on fire for every $100 in revenue.
3. Short Cash Runway Exposes Shareholders to Potential Dilution
As long-term investors, the risk we care about most is the permanent loss of capital, which can happen when a company goes bankrupt or raises money from a disadvantaged position. This is separate from short-term stock price volatility, something we are much less bothered by.
Krispy Kreme burned through $98.81 million of cash over the last year, and its $1.44 billion of debt exceeds the $31.15 million of cash on its balance sheet. This is a deal breaker for us because indebted loss-making companies spell trouble.
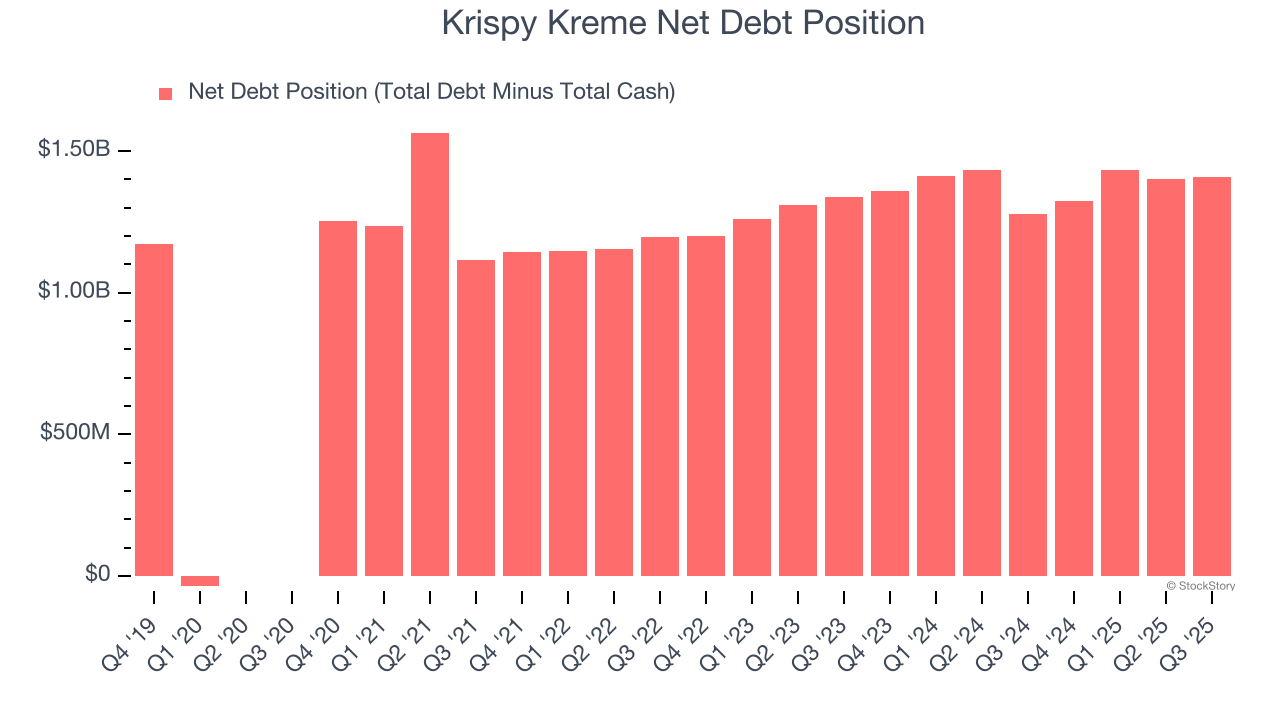
Unless the Krispy Kreme’s fundamentals change quickly, it might find itself in a position where it must raise capital from investors to continue operating. Whether that would be favorable is unclear because dilution is a headwind for shareholder returns.
We remain cautious of Krispy Kreme until it generates consistent free cash flow or any of its announced financing plans materialize on its balance sheet.
Final Judgment
Krispy Kreme falls short of our quality standards. Following the recent surge, the stock trades at 5.8× forward EV-to-EBITDA (or $4.68 per share). While this valuation is optically cheap, the potential downside is huge given its shaky fundamentals. There are more exciting stocks to buy at the moment. We’d suggest looking at a top digital advertising platform riding the creator economy.
Stocks We Would Buy Instead of Krispy Kreme
Your portfolio can’t afford to be based on yesterday’s story. The risk in a handful of heavily crowded stocks is rising daily.
The names generating the next wave of massive growth are right here in our Top 5 Strong Momentum Stocks for this week. This is a curated list of our High Quality stocks that have generated a market-beating return of 244% over the last five years (as of June 30, 2025).
Stocks that have made our list include now familiar names such as Nvidia (+1,326% between June 2020 and June 2025) as well as under-the-radar businesses like the once-micro-cap company Kadant (+351% five-year return). Find your next big winner with StockStory today.
StockStory is growing and hiring equity analyst and marketing roles. Are you a 0 to 1 builder passionate about the markets and AI? See the open roles here.


