Over the last six months, Boise Cascade’s shares have sunk to $76.26, producing a disappointing 13.4% loss - a stark contrast to the S&P 500’s 13.9% gain. This was partly due to its softer quarterly results and may have investors wondering how to approach the situation.
Is now the time to buy Boise Cascade, or should you be careful about including it in your portfolio? Check out our in-depth research report to see what our analysts have to say, it’s free for active Edge members.
Why Do We Think Boise Cascade Will Underperform?
Despite the more favorable entry price, we're cautious about Boise Cascade. Here are three reasons we avoid BCC and a stock we'd rather own.
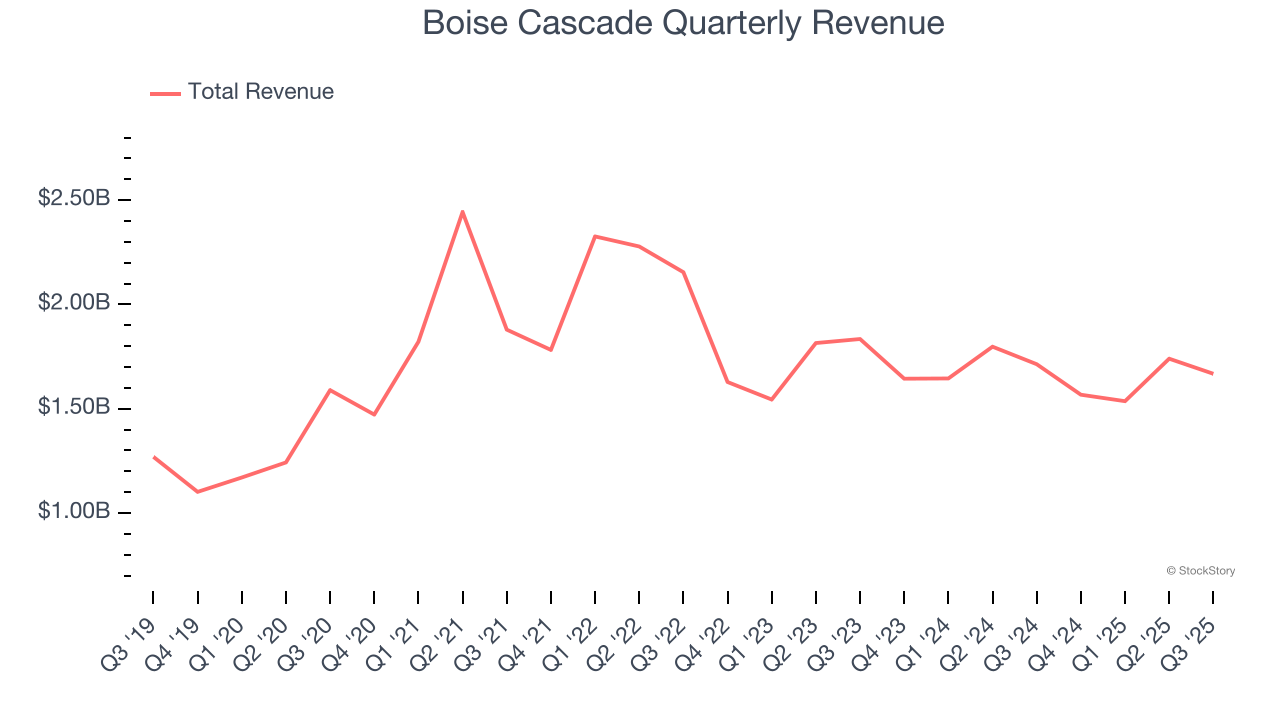
1. Long-Term Revenue Growth Disappoints
A company’s long-term performance is an indicator of its overall quality. Any business can put up a good quarter or two, but the best consistently grow over the long haul. Over the last five years, Boise Cascade grew its sales at a tepid 5% compounded annual growth rate. This fell short of our benchmark for the industrials sector.
2. Free Cash Flow Margin Dropping
If you’ve followed StockStory for a while, you know we emphasize free cash flow. Why, you ask? We believe that in the end, cash is king, and you can’t use accounting profits to pay the bills.
As you can see below, Boise Cascade’s margin dropped by 6.8 percentage points over the last five years. This along with its unexciting margin put the company in a tough spot, and shareholders are likely hoping it can reverse course. If the trend continues, it could signal it’s in the middle of a big investment cycle. Boise Cascade’s free cash flow margin for the trailing 12 months was breakeven.

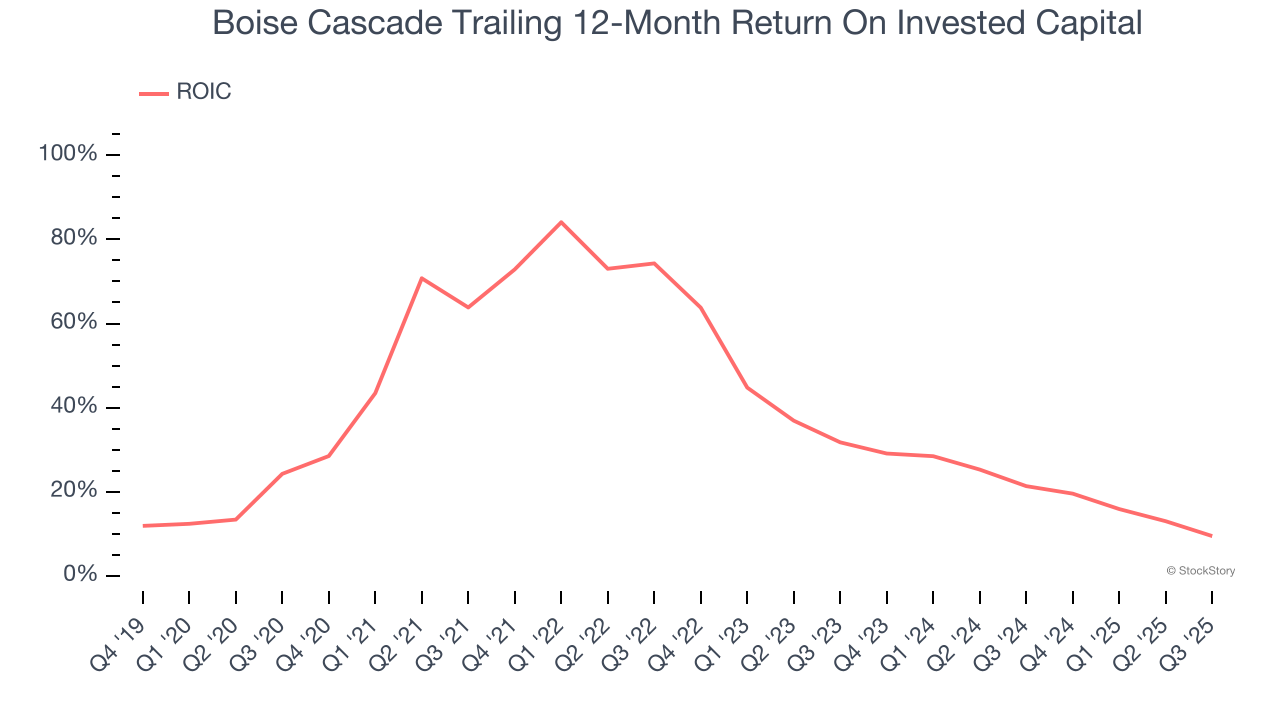
3. New Investments Fail to Bear Fruit as ROIC Declines
A company’s ROIC, or return on invested capital, shows how much operating profit it makes compared to the money it has raised (debt and equity).
We like to invest in businesses with high returns, but the trend in a company’s ROIC is what often surprises the market and moves the stock price. Over the last few years, Boise Cascade’s ROIC has unfortunately decreased significantly. We like what management has done in the past, but its declining returns are perhaps a symptom of fewer profitable growth opportunities.
Final Judgment
Boise Cascade doesn’t pass our quality test. After the recent drawdown, the stock trades at 21.4× forward P/E (or $76.26 per share). This valuation tells us a lot of optimism is priced in - you can find more timely opportunities elsewhere. We’d suggest looking at a fast-growing restaurant franchise with an A+ ranch dressing sauce.
High-Quality Stocks for All Market Conditions
The market’s up big this year - but there’s a catch. Just 4 stocks account for half the S&P 500’s entire gain. That kind of concentration makes investors nervous, and for good reason. While everyone piles into the same crowded names, smart investors are hunting quality where no one’s looking - and paying a fraction of the price. Check out the high-quality names we’ve flagged in our Top 6 Stocks for this week. This is a curated list of our High Quality stocks that have generated a market-beating return of 244% over the last five years (as of June 30, 2025).
Stocks that have made our list include now familiar names such as Nvidia (+1,326% between June 2020 and June 2025) as well as under-the-radar businesses like the once-small-cap company Comfort Systems (+782% five-year return). Find your next big winner with StockStory today.
StockStory is growing and hiring equity analyst and marketing roles. Are you a 0 to 1 builder passionate about the markets and AI? See the open roles here.