
Over the last six months, Navient’s shares have sunk to $12.96, producing a disappointing 5.3% loss - a stark contrast to the S&P 500’s 13.9% gain. This was partly due to its softer quarterly results and might have investors contemplating their next move.
Is now the time to buy Navient, or should you be careful about including it in your portfolio? Dive into our full research report to see our analyst team’s opinion, it’s free for active Edge members.
Why Do We Think Navient Will Underperform?
Even though the stock has become cheaper, we're swiping left on Navient for now. Here are three reasons you should be careful with NAVI and a stock we'd rather own.
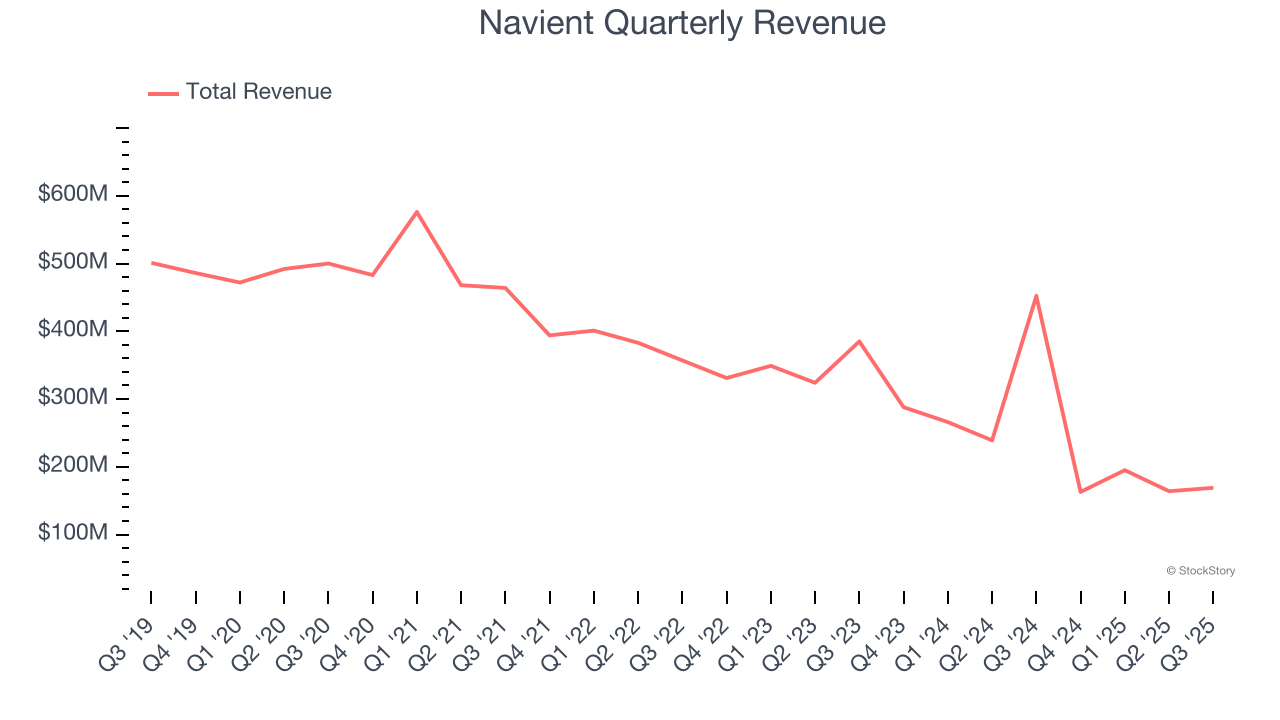
1. Revenue Spiraling Downwards
A company’s long-term sales performance is one signal of its overall quality. Even a bad business can shine for one or two quarters, but a top-tier one grows for years.
Over the last five years, Navient’s demand was weak and its revenue declined by 18.7% per year. This was below our standards and signals it’s a low quality business.
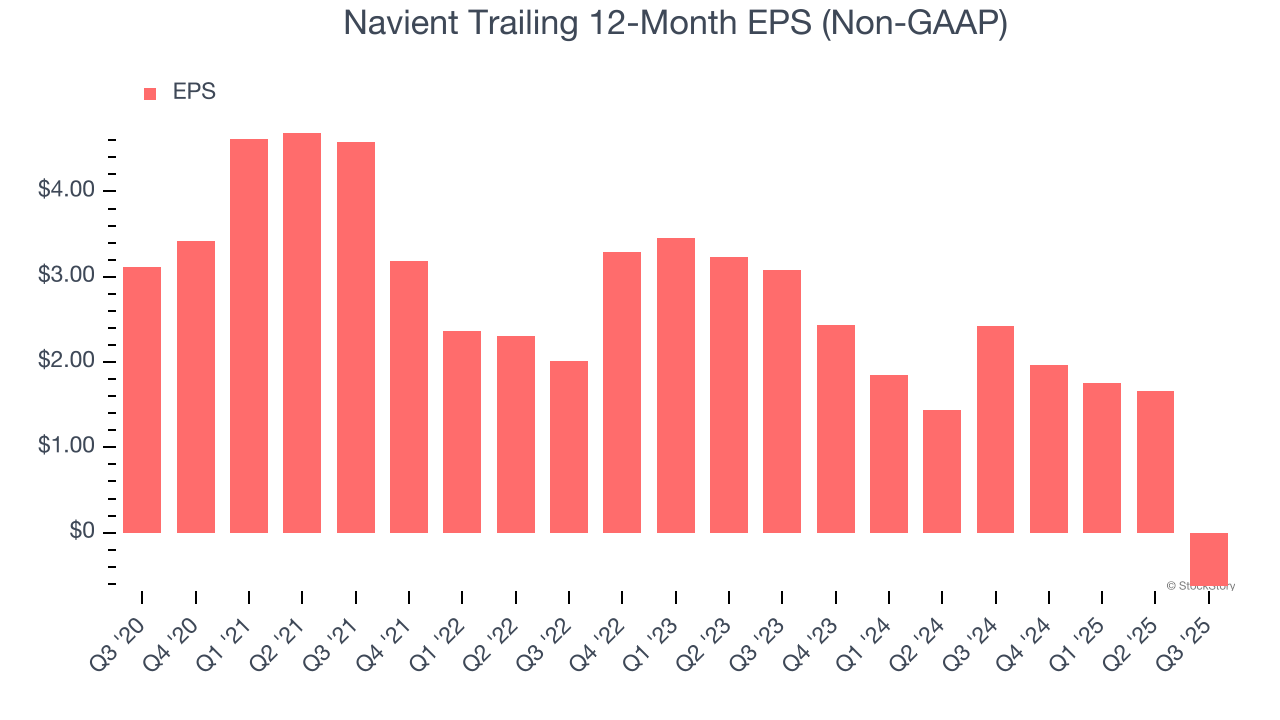
2. EPS Trending Down
We track the long-term change in earnings per share (EPS) because it highlights whether a company’s growth is profitable.
Sadly for Navient, its EPS and revenue declined by 17.1% and 18.7% annually over the last five years. We tend to steer our readers away from companies with falling revenue and EPS, where diminishing earnings could imply changing secular trends and preferences. If the tide turns unexpectedly, Navient’s low margin of safety could leave its stock price susceptible to large downswings.
The debt-to-equity ratio is a widely used measure to assess a company's balance sheet health. A higher ratio means that a business aggressively financed its growth with debt. This can result in higher earnings (if the borrowed funds are invested profitably) but also increases risk.
If debt levels are too high, there could be difficulties in meeting obligations, especially during economic downturns or periods of rising interest rates if the debt has variable-rate payments.
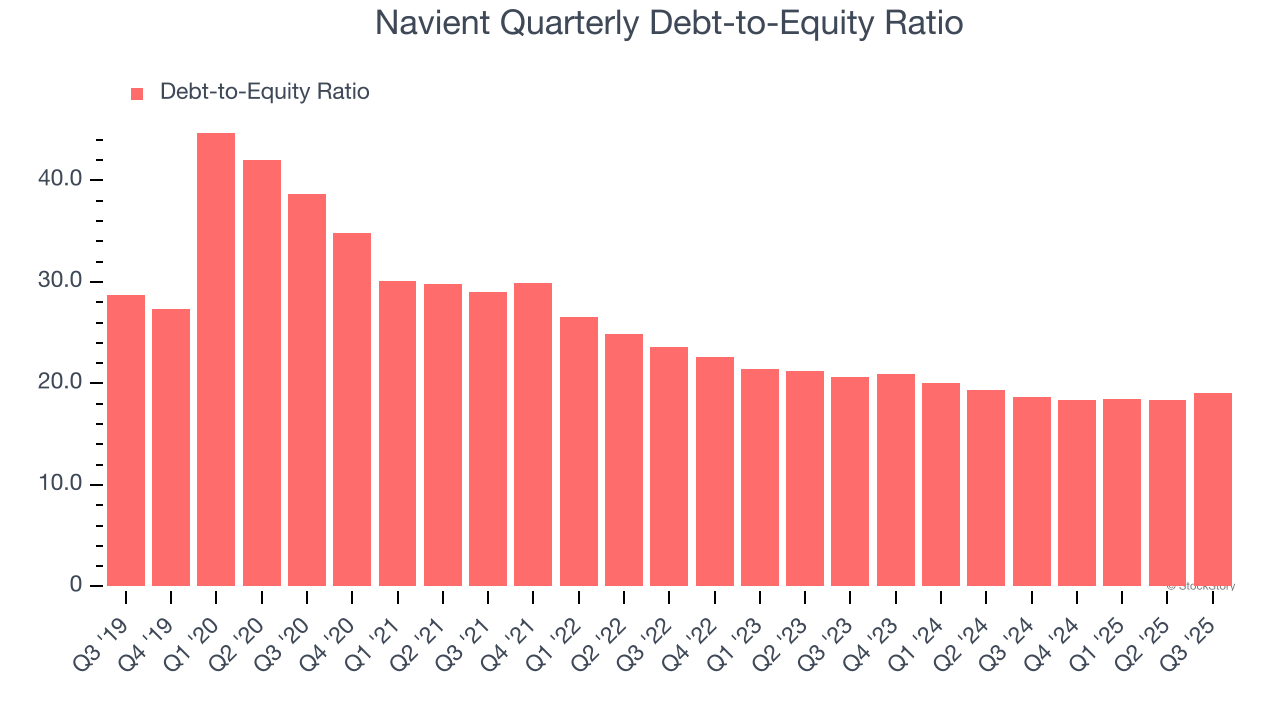
Navient currently has $46.41 billion of debt and $2.44 billion of shareholder's equity on its balance sheet, and over the past four quarters, has averaged a debt-to-equity ratio of 18.6×. We think this is dangerous - for a financials business, anything above 3.5× raises red flags.
Final Judgment
Navient doesn’t pass our quality test. After the recent drawdown, the stock trades at 11.9× forward P/E (or $12.96 per share). This multiple tells us a lot of good news is priced in - you can find more timely opportunities elsewhere. We’d recommend looking at one of our top software and edge computing picks.
Stocks We Would Buy Instead of Navient
If your portfolio success hinges on just 4 stocks, your wealth is built on fragile ground. You have a small window to secure high-quality assets before the market widens and these prices disappear.
Don’t wait for the next volatility shock. Check out our Top 5 Strong Momentum Stocks for this week. This is a curated list of our High Quality stocks that have generated a market-beating return of 244% over the last five years (as of June 30, 2025).
Stocks that have made our list include now familiar names such as Nvidia (+1,326% between June 2020 and June 2025) as well as under-the-radar businesses like the once-small-cap company Comfort Systems (+782% five-year return). Find your next big winner with StockStory today.
StockStory is growing and hiring equity analyst and marketing roles. Are you a 0 to 1 builder passionate about the markets and AI? See the open roles here.