
StoneX trades at $100.35 and has moved in lockstep with the market. Its shares have returned 17.9% over the last six months while the S&P 500 has gained 13.9%.
Is there a buying opportunity in StoneX, or does it present a risk to your portfolio? Get the full stock story straight from our expert analysts, it’s free for active Edge members.
Why Is StoneX Not Exciting?
We're swiping left on StoneX for now. Here are three reasons why SNEX doesn't excite us and a stock we'd rather own.
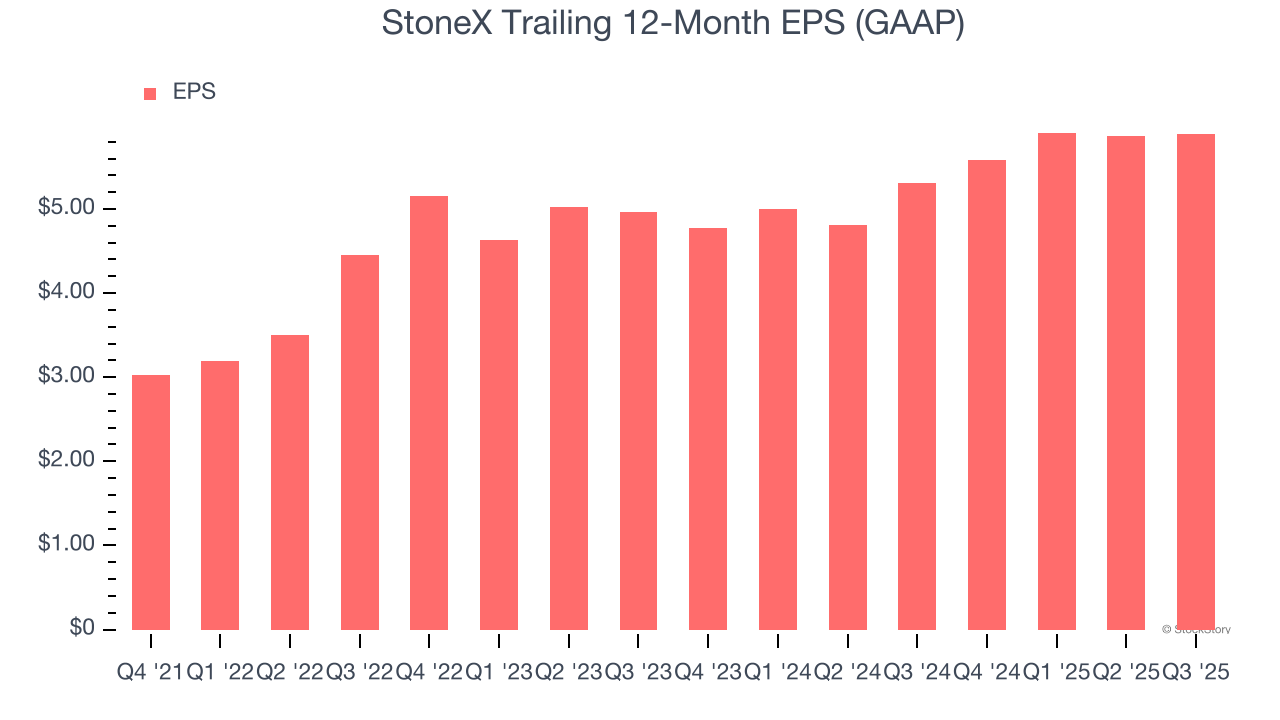
1. EPS Barely Growing
We track the long-term change in earnings per share (EPS) because it highlights whether a company’s growth is profitable.
StoneX’s EPS grew at a weak 1.7% compounded annual growth rate over the last five years, lower than its 19.4% annualized revenue growth. This tells us the company became less profitable on a per-share basis as it expanded.
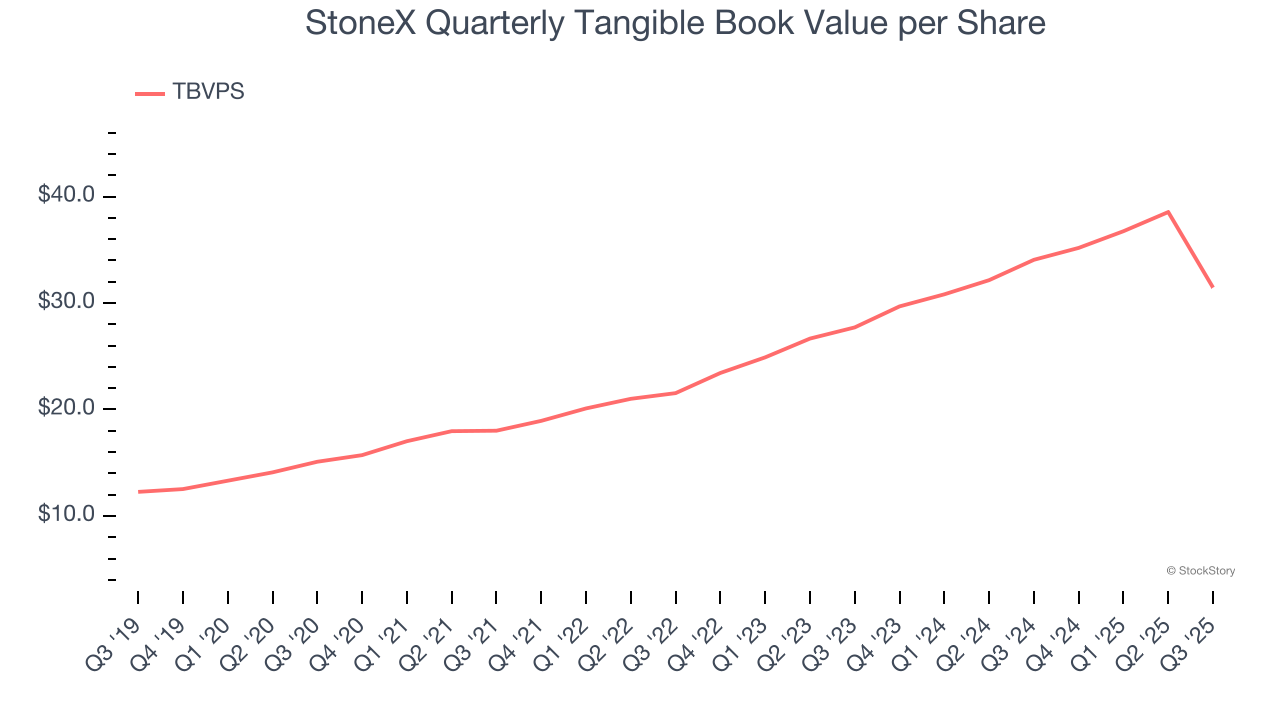
2. Substandard TBVPS Growth Indicates Limited Asset Expansion
Tangible book value per share (TBVPS) is a crucial metric that measures the actual value of shareholders’ equity, stripping out goodwill and other intangible assets that may not be recoverable in a worst-case scenario.
Although StoneX’s TBVPS increased by 15.8% annually over the last five years, growth has recently decelerated to a mediocre 6.5% over the past two years (from $27.71 to $31.45 per share).
The debt-to-equity ratio is a widely used measure to assess a company's balance sheet health. A higher ratio means that a business aggressively financed its growth with debt. This can result in higher earnings (if the borrowed funds are invested profitably) but also increases risk.
If debt levels are too high, there could be difficulties in meeting obligations, especially during economic downturns or periods of rising interest rates if the debt has variable-rate payments.
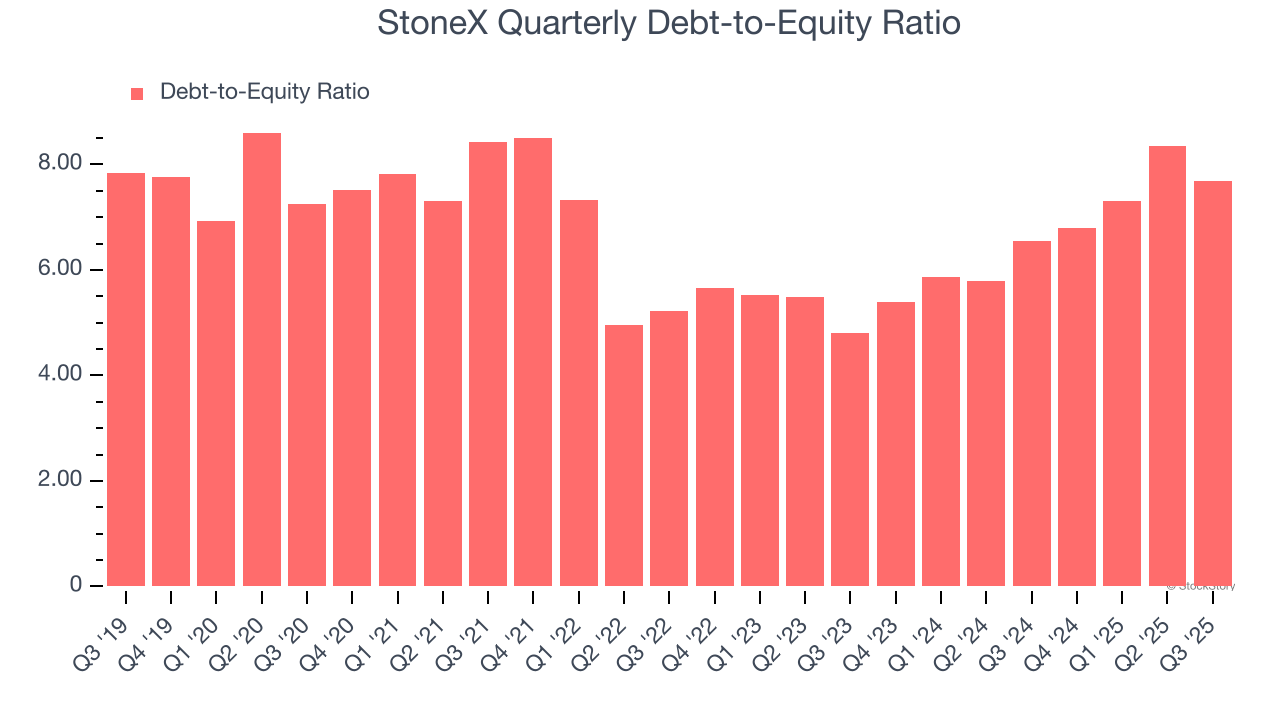
StoneX currently has $18.25 billion of debt and $2.38 billion of shareholder's equity on its balance sheet, and over the past four quarters, has averaged a debt-to-equity ratio of 7.5×. We think this is dangerous - for a financials business, anything above 3.5× raises red flags.
Final Judgment
StoneX’s business quality ultimately falls short of our standards. That said, the stock currently trades at 1.7× forward P/E (or $100.35 per share). Investors with a higher risk tolerance might like the company, but we don’t really see a big opportunity at the moment. We're pretty confident there are more exciting stocks to buy at the moment. Let us point you toward one of our all-time favorite software stocks.
Stocks We Would Buy Instead of StoneX
If your portfolio success hinges on just 4 stocks, your wealth is built on fragile ground. You have a small window to secure high-quality assets before the market widens and these prices disappear.
Don’t wait for the next volatility shock. Check out our Top 5 Strong Momentum Stocks for this week. This is a curated list of our High Quality stocks that have generated a market-beating return of 244% over the last five years (as of June 30, 2025).
Stocks that have made our list include now familiar names such as Nvidia (+1,326% between June 2020 and June 2025) as well as under-the-radar businesses like the once-micro-cap company Kadant (+351% five-year return). Find your next big winner with StockStory today.
StockStory is growing and hiring equity analyst and marketing roles. Are you a 0 to 1 builder passionate about the markets and AI? See the open roles here.


