
Since June 2025, Live Nation has been in a holding pattern, floating around $141.94. The stock also fell short of the S&P 500’s 13.9% gain during that period.
Is now the time to buy Live Nation, or should you be careful about including it in your portfolio? See what our analysts have to say in our full research report, it’s free for active Edge members.
Why Do We Think Live Nation Will Underperform?
We're sitting this one out for now. Here are three reasons there are better opportunities than LYV and a stock we'd rather own.
1. Weak Growth in Events Points to Soft Demand
Revenue growth can be broken down into changes in price and volume (for companies like Live Nation, our preferred volume metric is events). While both are important, the latter is the most critical to analyze because prices have a ceiling.
Live Nation’s events came in at 12,289 in the latest quarter, and over the last two years, averaged 6.8% year-on-year growth. This performance was underwhelming and suggests it might have to lower prices or invest in product improvements to accelerate growth, factors that can hinder near-term profitability. 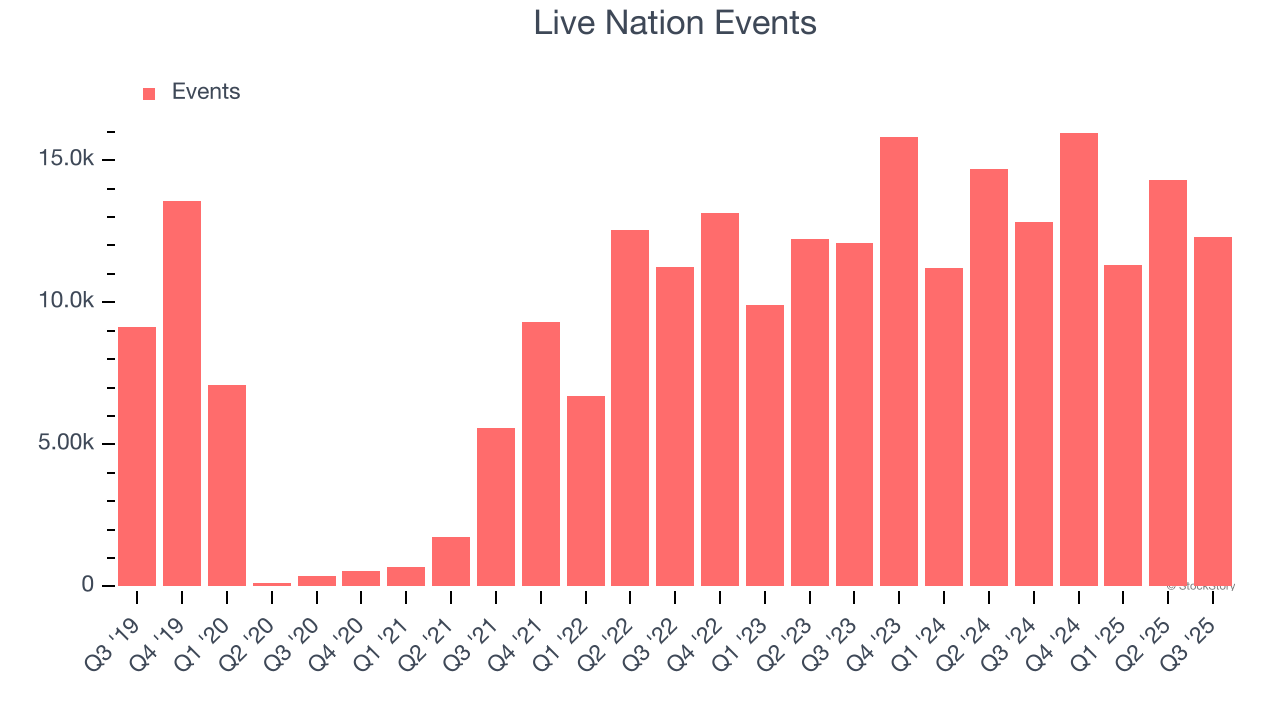
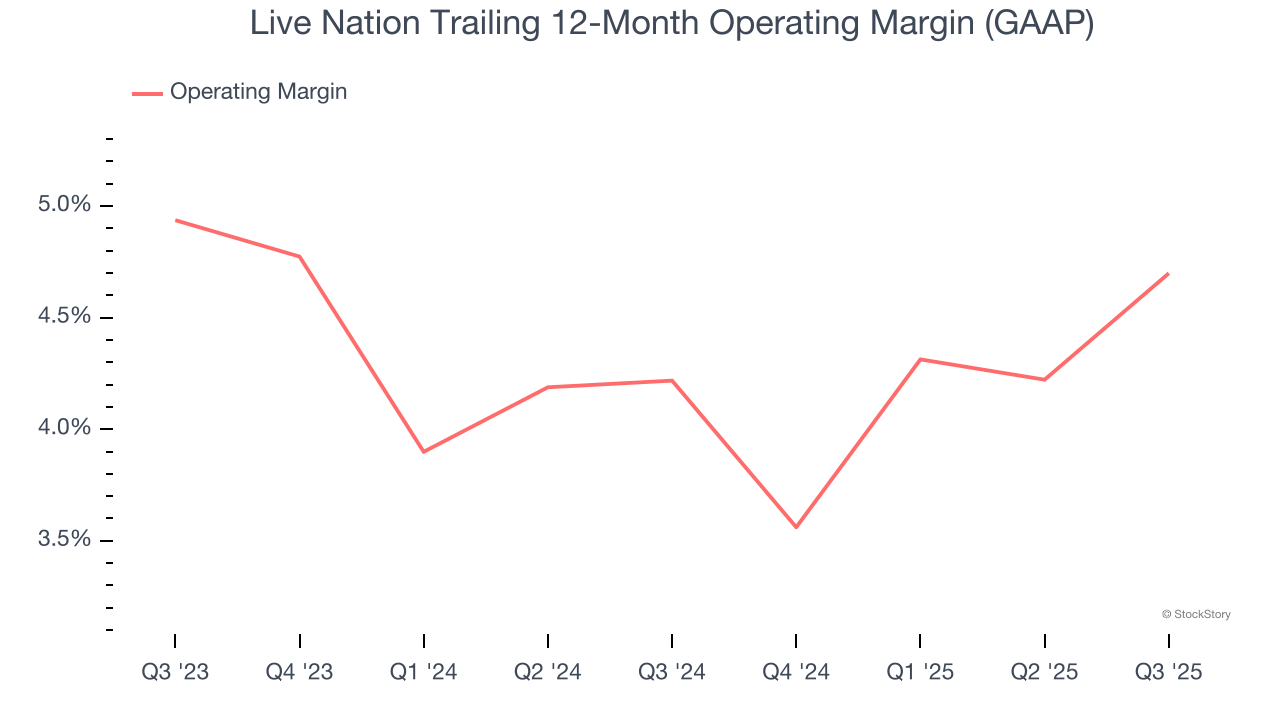
2. Weak Operating Margin Could Cause Trouble
Operating margin is an important measure of profitability as it shows the portion of revenue left after accounting for all core expenses – everything from the cost of goods sold to advertising and wages. It’s also useful for comparing profitability across companies with different levels of debt and tax rates because it excludes interest and taxes.
Live Nation’s operating margin might fluctuated slightly over the last 12 months but has generally stayed the same, averaging 4.5% over the last two years. This profitability was inadequate for a consumer discretionary business and caused by its suboptimal cost structure.
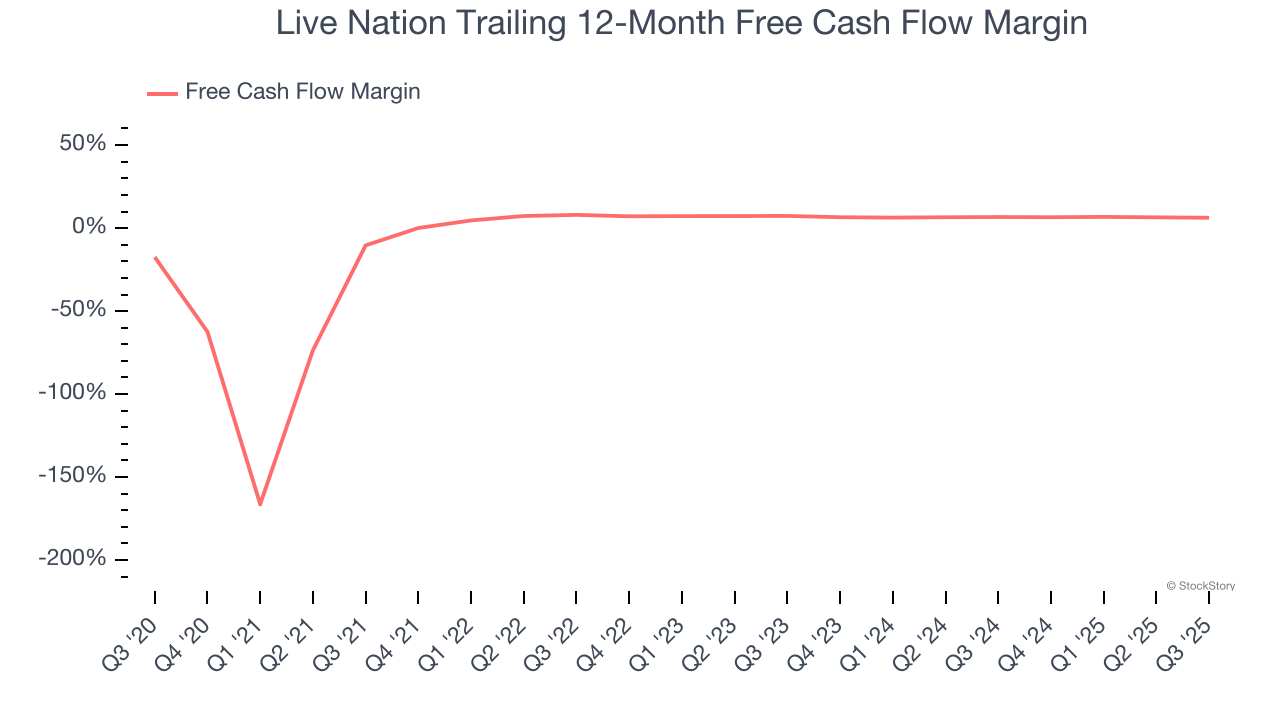
3. Mediocre Free Cash Flow Margin Limits Reinvestment Potential
If you’ve followed StockStory for a while, you know we emphasize free cash flow. Why, you ask? We believe that in the end, cash is king, and you can’t use accounting profits to pay the bills.
Live Nation has shown poor cash profitability over the last two years, giving the company limited opportunities to return capital to shareholders. Its free cash flow margin averaged 6.5%, lousy for a consumer discretionary business.
Final Judgment
Live Nation doesn’t pass our quality test. With its shares underperforming the market lately, the stock trades at 79.6× forward P/E (or $141.94 per share). This multiple tells us a lot of good news is priced in - you can find more timely opportunities elsewhere. We’d suggest looking at one of our all-time favorite software stocks.
Stocks We Like More Than Live Nation
Your portfolio can’t afford to be based on yesterday’s story. The risk in a handful of heavily crowded stocks is rising daily.
The names generating the next wave of massive growth are right here in our Top 9 Market-Beating Stocks. This is a curated list of our High Quality stocks that have generated a market-beating return of 244% over the last five years (as of June 30, 2025).
Stocks that have made our list include now familiar names such as Nvidia (+1,326% between June 2020 and June 2025) as well as under-the-radar businesses like the once-micro-cap company Tecnoglass (+1,754% five-year return). Find your next big winner with StockStory today.
StockStory is growing and hiring equity analyst and marketing roles. Are you a 0 to 1 builder passionate about the markets and AI? See the open roles here.


