
Zions Bancorporation’s 23.2% return over the past six months has outpaced the S&P 500 by 8.9%, and its stock price has climbed to $58.98 per share. This was partly thanks to its solid quarterly results, and the run-up might have investors contemplating their next move.
Is now the time to buy Zions Bancorporation, or should you be careful about including it in your portfolio? Get the full breakdown from our expert analysts, it’s free for active Edge members.
Why Is Zions Bancorporation Not Exciting?
Despite the momentum, we're swiping left on Zions Bancorporation for now. Here are three reasons there are better opportunities than ZION and a stock we'd rather own.
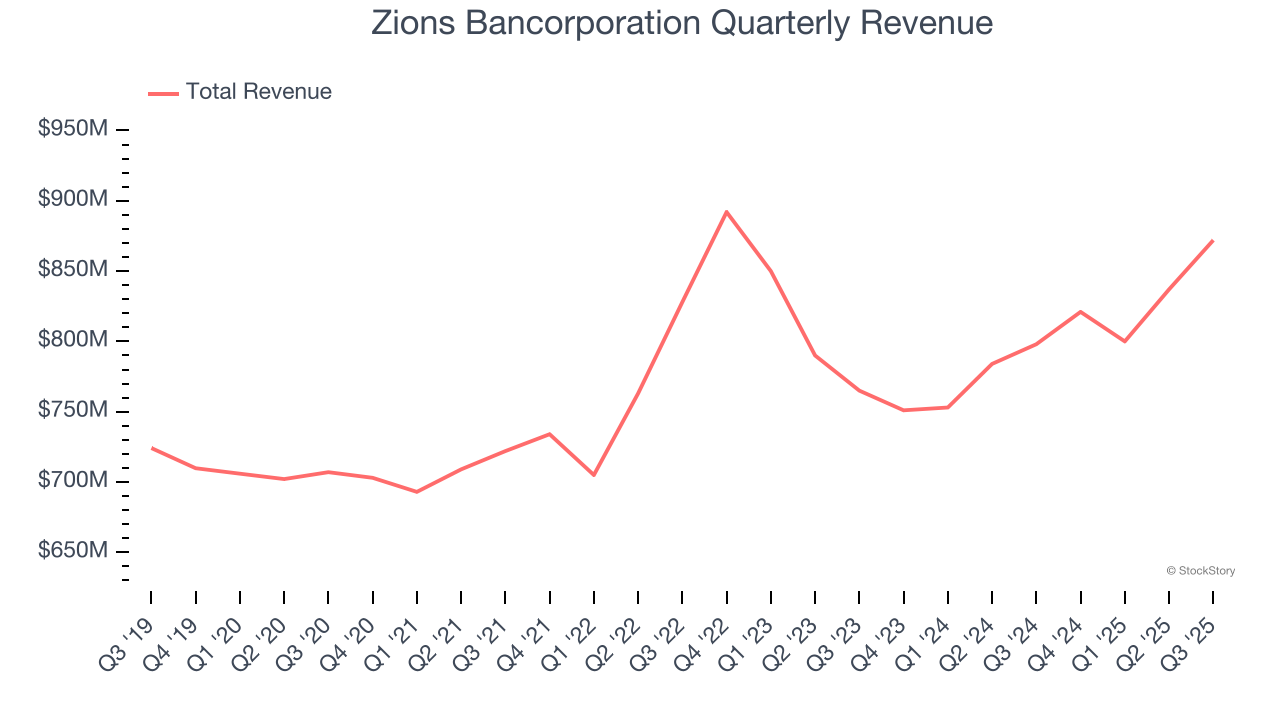
1. Long-Term Revenue Growth Disappoints
Net interest income and and fee-based revenue are the two pillars supporting bank earnings. The former captures profit from the gap between lending rates and deposit costs, while the latter encompasses charges for banking services, credit products, wealth management, and trading activities.
Regrettably, Zions Bancorporation’s revenue grew at a sluggish 3.3% compounded annual growth rate over the last five years. This was below our standard for the banking sector.
2. Projected Net Interest Income Growth Is Slim
Forecasted net interest income by Wall Street analysts signals a company’s potential. Predictions may not always be accurate, but accelerating growth typically boosts valuation multiples and stock prices while slowing growth does the opposite.
Over the next 12 months, sell-side analysts expect Zions Bancorporation’s net interest income to drop by 37.3%, a decrease from its 30.3% annualized growth for the past two years. This projection is below its 30.3% annualized growth rate for the past two years.
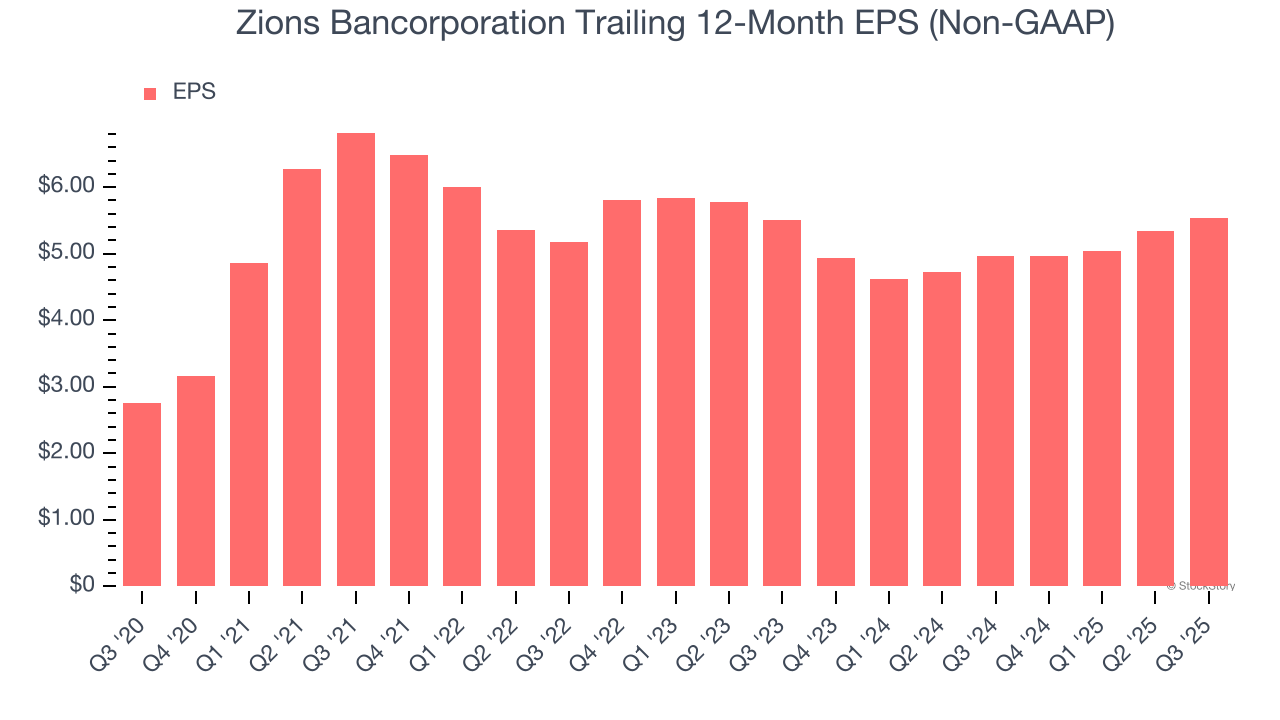
3. EPS Growth Has Stalled Over the Last Two Years
While long-term earnings trends give us the big picture, we also track EPS over a shorter period because it can provide insight into an emerging theme or development for the business.
Zions Bancorporation’s EPS was flat over the last two years, just like its revenue. This performance was underwhelming across the board.
Final Judgment
Zions Bancorporation’s business quality ultimately falls short of our standards. With its shares beating the market recently, the stock trades at 1.2× forward P/B (or $58.98 per share). While this valuation is fair, the upside isn’t great compared to the potential downside. We're pretty confident there are superior stocks to buy right now. We’d suggest looking at a safe-and-steady industrials business benefiting from an upgrade cycle.
High-Quality Stocks for All Market Conditions
If your portfolio success hinges on just 4 stocks, your wealth is built on fragile ground. You have a small window to secure high-quality assets before the market widens and these prices disappear.
Don’t wait for the next volatility shock. Check out our Top 6 Stocks for this week. This is a curated list of our High Quality stocks that have generated a market-beating return of 244% over the last five years (as of June 30, 2025).
Stocks that have made our list include now familiar names such as Nvidia (+1,326% between June 2020 and June 2025) as well as under-the-radar businesses like the once-small-cap company Exlservice (+354% five-year return). Find your next big winner with StockStory today.
StockStory is growing and hiring equity analyst and marketing roles. Are you a 0 to 1 builder passionate about the markets and AI? See the open roles here.