Integral Ad Science’s 25% return over the past six months has outpaced the S&P 500 by 11.1%, and its stock price has climbed to $10.28 per share. This was partly due to its solid quarterly results, and the performance may have investors wondering how to approach the situation.
Is there a buying opportunity in Integral Ad Science, or does it present a risk to your portfolio? Get the full breakdown from our expert analysts, it’s free for active Edge members.
Why Is Integral Ad Science Not Exciting?
We’re glad investors have benefited from the price increase, but we don't have much confidence in Integral Ad Science. Here are three reasons there are better opportunities than IAS and a stock we'd rather own.
1. Lackluster Revenue Growth
We at StockStory place the most emphasis on long-term growth, but within software, a stretched historical view may miss recent innovations or disruptive industry trends. Integral Ad Science’s recent performance shows its demand has slowed as its annualized revenue growth of 13.6% over the last two years was below its five-year trend. 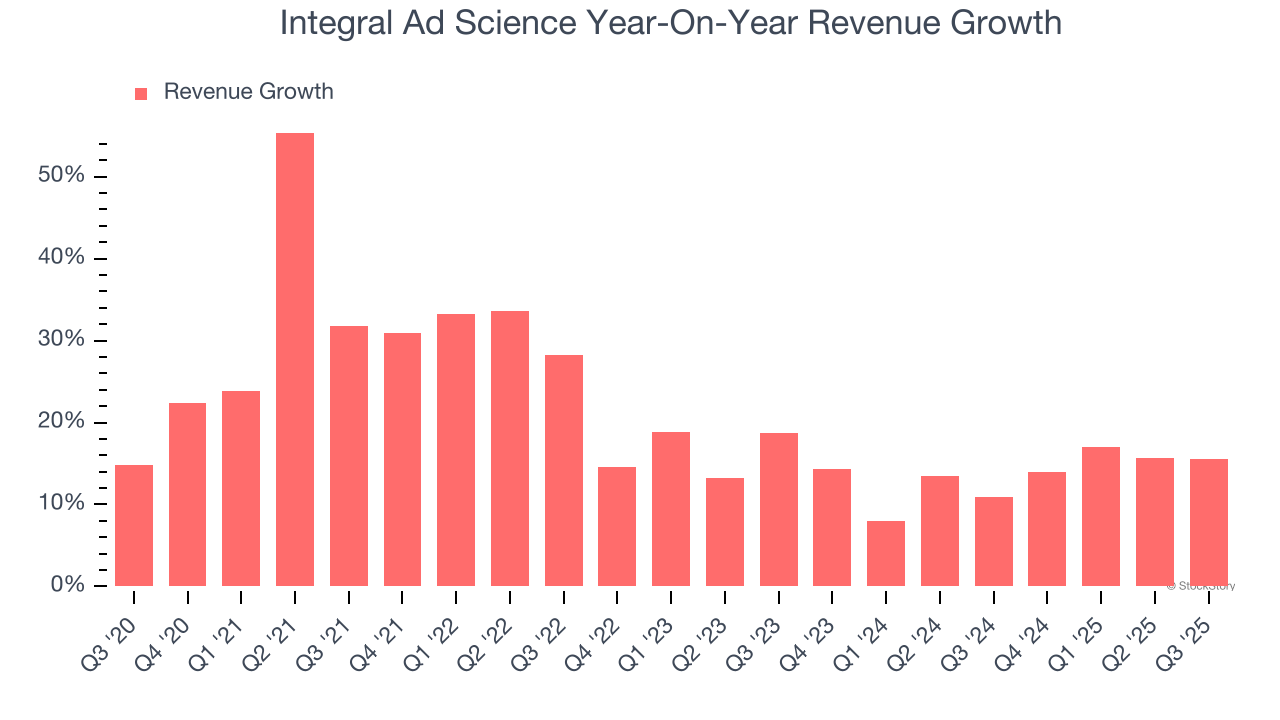
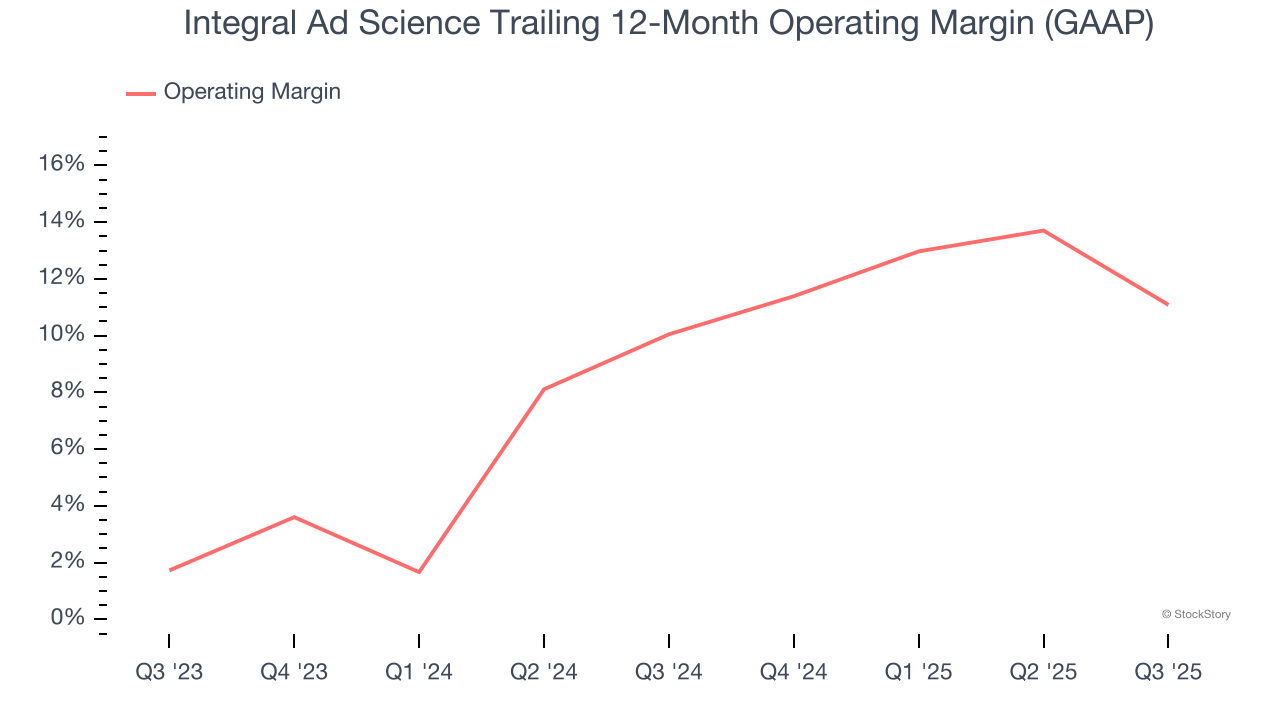
2. Operating Margin Rising, Profits Up
Many software businesses adjust their profits for stock-based compensation (SBC), but we prioritize GAAP operating margin because SBC is a real expense used to attract and retain engineering and sales talent. This metric shows how much revenue remains after accounting for all core expenses – everything from the cost of goods sold to sales and R&D.
Looking at the trend in its profitability, Integral Ad Science’s operating margin rose by 1 percentage points over the last two years, as its sales growth gave it operating leverage. Its operating margin for the trailing 12 months was 11.1%.
3. Cash Flow Margin Set to Decline
Free cash flow isn't a prominently featured metric in company financials and earnings releases, but we think it's telling because it accounts for all operating and capital expenses, making it tough to manipulate. Cash is king.
Over the next year, analysts predict Integral Ad Science’s cash conversion will fall. Their consensus estimates imply its free cash flow margin of 29.9% for the last 12 months will decrease to 24.4%.
Final Judgment
Integral Ad Science’s business quality ultimately falls short of our standards. With its shares outperforming the market lately, the stock trades at 2.6× forward price-to-sales (or $10.28 per share). While this valuation is fair, the upside isn’t great compared to the potential downside. We're fairly confident there are better stocks to buy right now. We’d recommend looking at a top digital advertising platform riding the creator economy.
Stocks We Would Buy Instead of Integral Ad Science
The market’s up big this year - but there’s a catch. Just 4 stocks account for half the S&P 500’s entire gain. That kind of concentration makes investors nervous, and for good reason. While everyone piles into the same crowded names, smart investors are hunting quality where no one’s looking - and paying a fraction of the price. Check out the high-quality names we’ve flagged in our Top 5 Growth Stocks for this month. This is a curated list of our High Quality stocks that have generated a market-beating return of 244% over the last five years (as of June 30, 2025).
Stocks that have made our list include now familiar names such as Nvidia (+1,326% between June 2020 and June 2025) as well as under-the-radar businesses like the once-micro-cap company Kadant (+351% five-year return). Find your next big winner with StockStory today.