
Office furniture manufacturer MillerKnoll (NASDAQ: MLKN) reported Q4 CY2025 results beating Wall Street’s revenue expectations, but sales fell by 1.6% year on year to $955.2 million. On top of that, next quarter’s revenue guidance ($943 million at the midpoint) was surprisingly good and 3.7% above what analysts were expecting. Its non-GAAP profit of $0.43 per share was 7.5% above analysts’ consensus estimates.
Is now the time to buy MillerKnoll? Find out by accessing our full research report, it’s free for active Edge members.
MillerKnoll (MLKN) Q4 CY2025 Highlights:
- Revenue: $955.2 million vs analyst estimates of $941.4 million (1.6% year-on-year decline, 1.5% beat)
- Adjusted EPS: $0.43 vs analyst estimates of $0.40 (7.5% beat)
- Revenue Guidance for Q1 CY2026 is $943 million at the midpoint, above analyst estimates of $909.6 million
- Adjusted EPS guidance for Q1 CY2026 is $0.45 at the midpoint, above analyst estimates of $0.41
- Operating Margin: 5.1%, down from 6.6% in the same quarter last year
- Backlog: $708.3 million at quarter end
- Market Capitalization: $1.14 billion
Company Overview
Created through the 2021 merger of industry icons Herman Miller and Knoll, MillerKnoll (NASDAQ: MLKN) designs, manufactures, and distributes interior furnishings for offices, healthcare facilities, educational settings, and homes worldwide.
Revenue Growth
Examining a company’s long-term performance can provide clues about its quality. Any business can put up a good quarter or two, but the best consistently grow over the long haul.
With $3.75 billion in revenue over the past 12 months, MillerKnoll is one of the larger companies in the business services industry and benefits from a well-known brand that influences purchasing decisions.
As you can see below, MillerKnoll’s sales grew at an impressive 9.4% compounded annual growth rate over the last five years. This shows it had high demand, a useful starting point for our analysis.
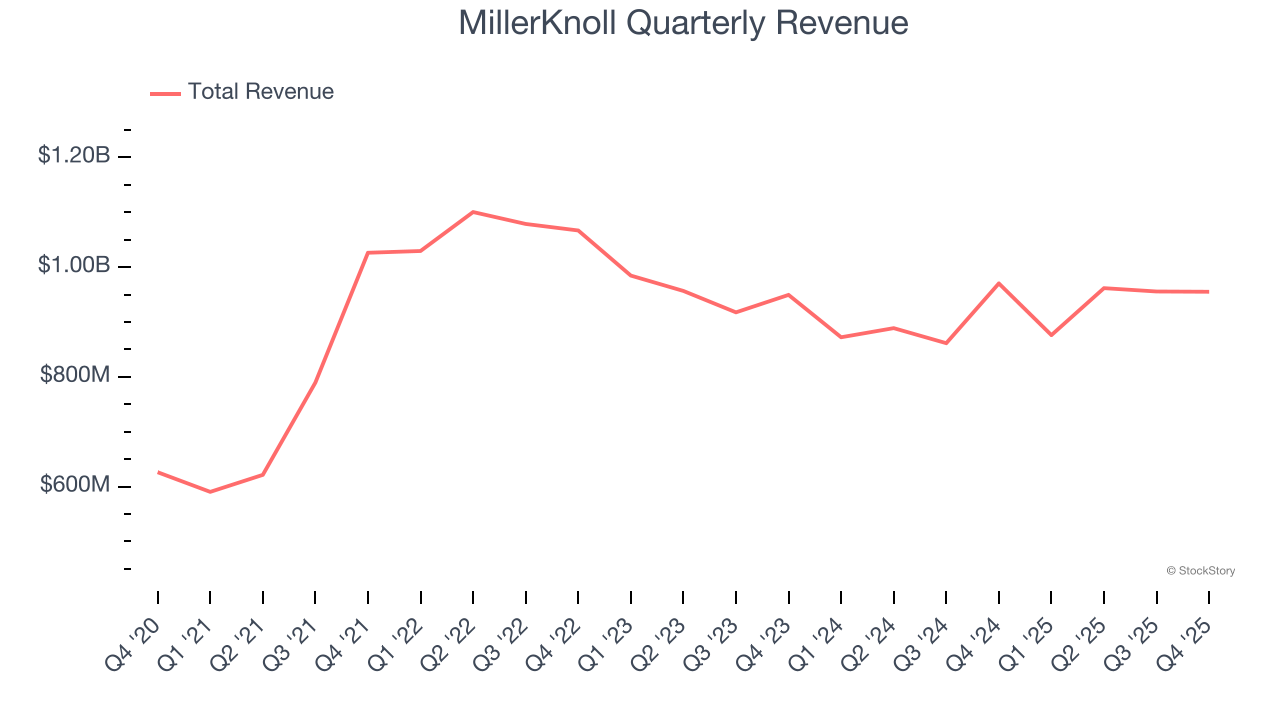
Long-term growth is the most important, but within business services, a half-decade historical view may miss new innovations or demand cycles. MillerKnoll’s recent performance shows its demand has slowed significantly as its revenue was flat over the last two years. 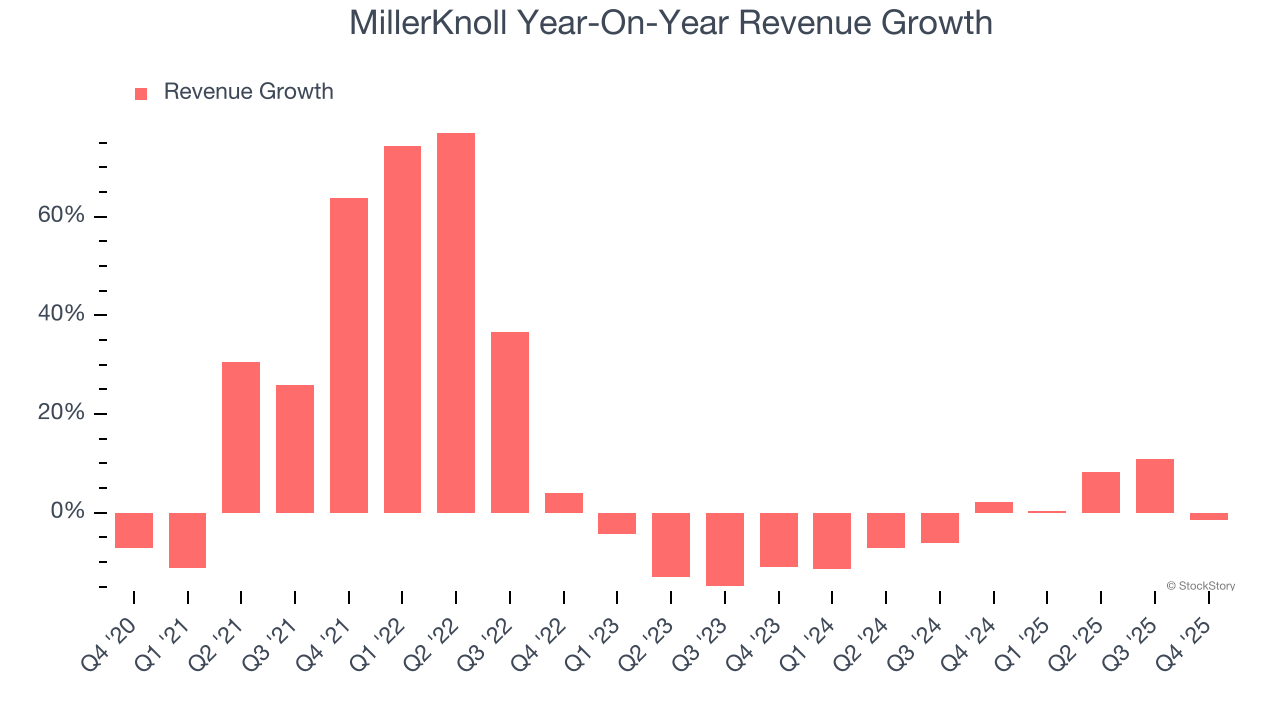
This quarter, MillerKnoll’s revenue fell by 1.6% year on year to $955.2 million but beat Wall Street’s estimates by 1.5%. Company management is currently guiding for a 7.6% year-on-year increase in sales next quarter.
Looking further ahead, sell-side analysts expect revenue to grow 2.5% over the next 12 months. While this projection indicates its newer products and services will catalyze better top-line performance, it is still below the sector average.
The 1999 book Gorilla Game predicted Microsoft and Apple would dominate tech before it happened. Its thesis? Identify the platform winners early. Today, enterprise software companies embedding generative AI are becoming the new gorillas. a profitable, fast-growing enterprise software stock that is already riding the automation wave and looking to catch the generative AI next.
Operating Margin
MillerKnoll was profitable over the last five years but held back by its large cost base. Its average operating margin of 5.5% was weak for a business services business.
On the plus side, MillerKnoll’s operating margin rose by 3.1 percentage points over the last five years, as its sales growth gave it operating leverage.
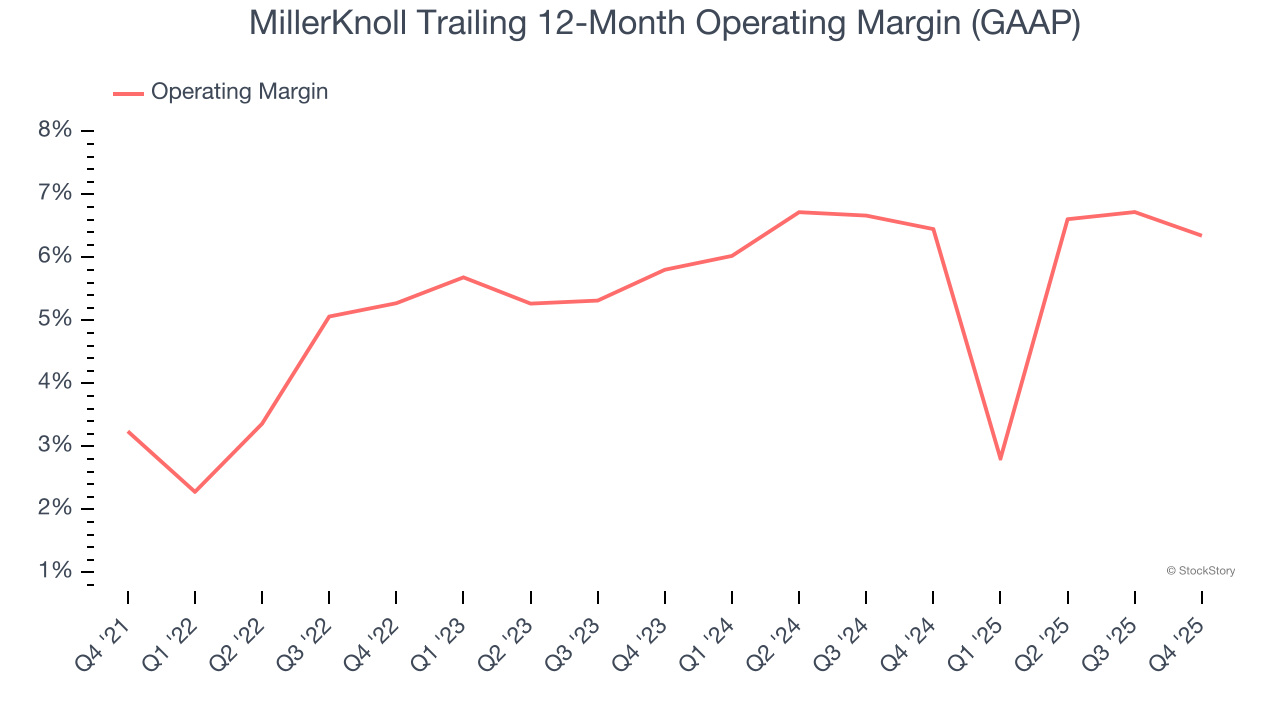
This quarter, MillerKnoll generated an operating margin profit margin of 5.1%, down 1.5 percentage points year on year. This reduction is quite minuscule and indicates the company’s overall cost structure has been relatively stable.
Earnings Per Share
Revenue trends explain a company’s historical growth, but the long-term change in earnings per share (EPS) points to the profitability of that growth – for example, a company could inflate its sales through excessive spending on advertising and promotions.
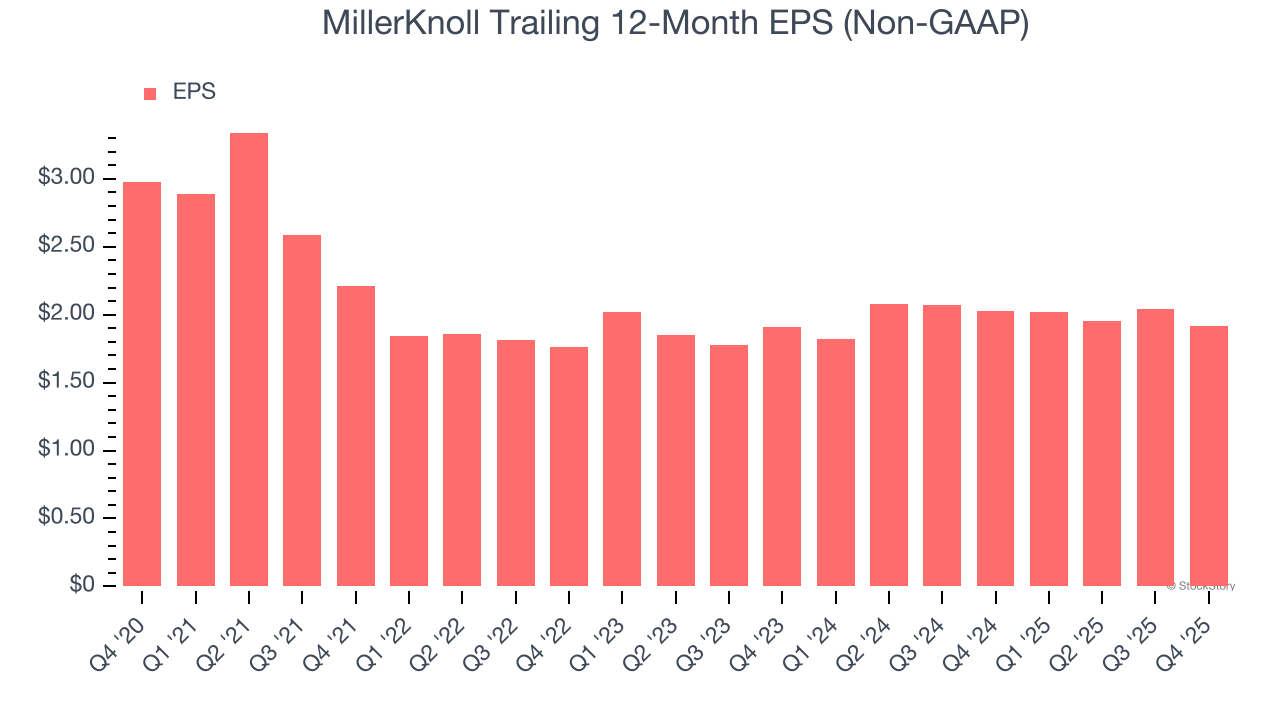
Sadly for MillerKnoll, its EPS declined by 8.4% annually over the last five years while its revenue grew by 9.4%. However, its operating margin actually improved during this time, telling us that non-fundamental factors such as interest expenses and taxes affected its ultimate earnings.
We can take a deeper look into MillerKnoll’s earnings to better understand the drivers of its performance. A five-year view shows MillerKnoll has diluted its shareholders, growing its share count by 16.3%. This dilution overshadowed its increased operational efficiency and has led to lower per share earnings. Taxes and interest expenses can also affect EPS but don’t tell us as much about a company’s fundamentals. 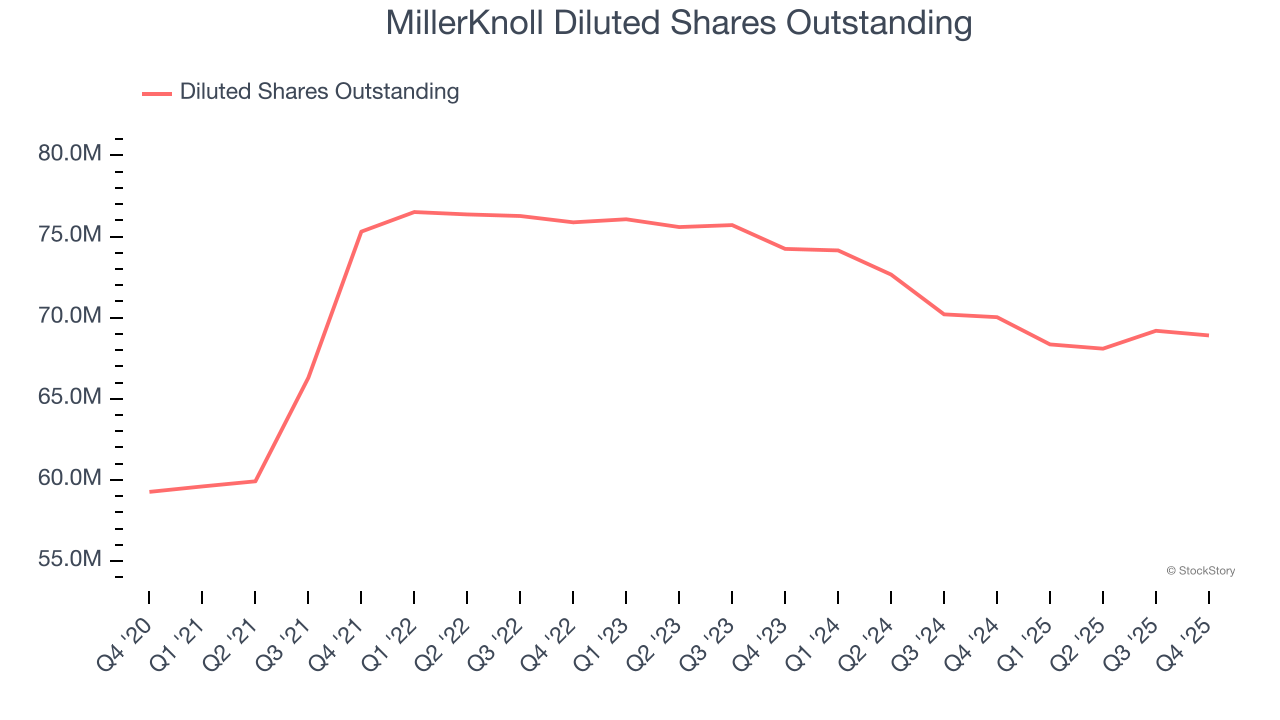
Like with revenue, we analyze EPS over a shorter period to see if we are missing a change in the business.
For MillerKnoll, EPS didn’t budge over the last two years, but at least that was better than its five-year trend. We hope its earnings can grow in the coming years.
In Q4, MillerKnoll reported adjusted EPS of $0.43, down from $0.55 in the same quarter last year. Despite falling year on year, this print beat analysts’ estimates by 7.5%. We also like to analyze expected EPS growth based on Wall Street analysts’ consensus projections, but there is insufficient data.
Key Takeaways from MillerKnoll’s Q4 Results
We were impressed by how significantly MillerKnoll blew past analysts’ EPS guidance for next quarter expectations this quarter. We were also glad its revenue guidance for next quarter trumped Wall Street’s estimates. Zooming out, we think this was a solid print. The stock traded up 4.9% to $18.40 immediately following the results.
Indeed, MillerKnoll had a rock-solid quarterly earnings result, but is this stock a good investment here? The latest quarter does matter, but not nearly as much as longer-term fundamentals and valuation, when deciding if the stock is a buy. We cover that in our actionable full research report which you can read here, it’s free for active Edge members.


