
Uniform and facility services provider Cintas (NASDAQ: CTAS) reported Q4 CY2025 results beating Wall Street’s revenue expectations, with sales up 9.3% year on year to $2.8 billion. The company expects the full year’s revenue to be around $11.19 billion, close to analysts’ estimates. Its GAAP profit of $1.21 per share was 1.3% above analysts’ consensus estimates.
Is now the time to buy Cintas? Find out by accessing our full research report, it’s free for active Edge members.
Cintas (CTAS) Q4 CY2025 Highlights:
- Revenue: $2.8 billion vs analyst estimates of $2.76 billion (9.3% year-on-year growth, 1.4% beat)
- EPS (GAAP): $1.21 vs analyst estimates of $1.19 (1.3% beat)
- The company slightly lifted its revenue guidance for the full year to $11.19 billion at the midpoint from $11.12 billion
- EPS (GAAP) guidance for the full year is $4.85 at the midpoint, roughly in line with what analysts were expecting
- Operating Margin: 23.4%, in line with the same quarter last year
- Free Cash Flow Margin: 15.2%, up from 13.3% in the same quarter last year
- Market Capitalization: $75.3 billion
Company Overview
Starting as a family business collecting and cleaning shop rags in Cincinnati, Cintas (NASDAQ: CTAS) provides corporate identity uniforms, facility services, and safety products to over one million businesses across North America.
Revenue Growth
Examining a company’s long-term performance can provide clues about its quality. Even a bad business can shine for one or two quarters, but a top-tier one grows for years.
With $10.79 billion in revenue over the past 12 months, Cintas is larger than most business services companies and benefits from economies of scale, enabling it to gain more leverage on its fixed costs than smaller competitors. This also gives it the flexibility to offer lower prices.
As you can see below, Cintas’s 9.3% annualized revenue growth over the last five years was impressive. This is a great starting point for our analysis because it shows Cintas’s demand was higher than many business services companies.
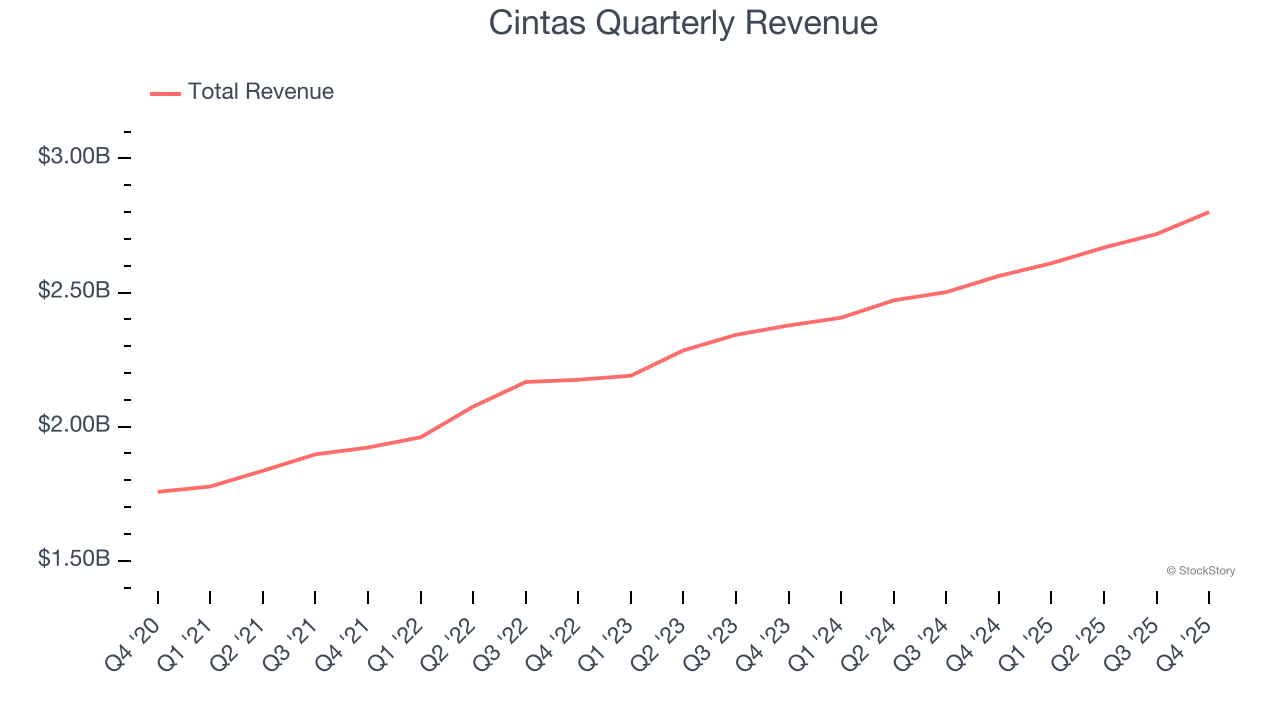
We at StockStory place the most emphasis on long-term growth, but within business services, a half-decade historical view may miss recent innovations or disruptive industry trends. Cintas’s annualized revenue growth of 8.4% over the last two years aligns with its five-year trend, suggesting its demand was predictably strong. 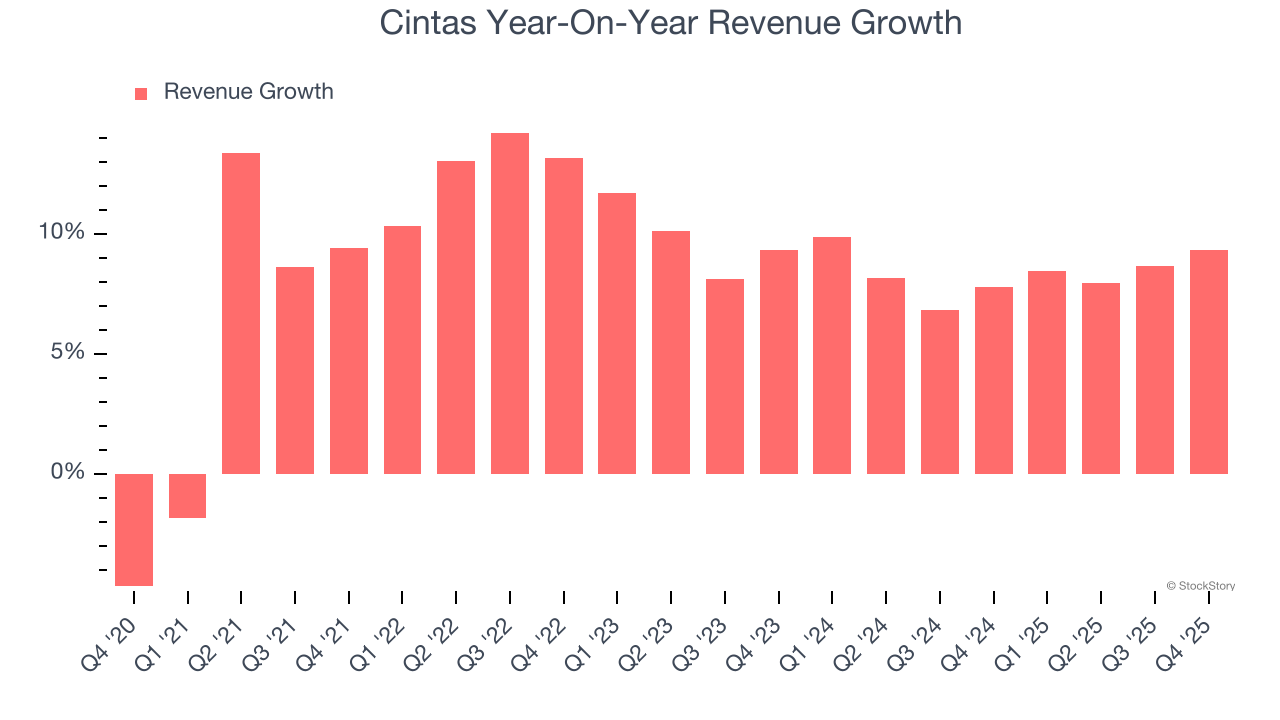
This quarter, Cintas reported year-on-year revenue growth of 9.3%, and its $2.8 billion of revenue exceeded Wall Street’s estimates by 1.4%.
Looking ahead, sell-side analysts expect revenue to grow 6.8% over the next 12 months, a slight deceleration versus the last two years. We still think its growth trajectory is satisfactory given its scale and implies the market is baking in success for its products and services.
Microsoft, Alphabet, Coca-Cola, Monster Beverage—all began as under-the-radar growth stories riding a massive trend. We’ve identified the next one: a profitable AI semiconductor play Wall Street is still overlooking. Go here for access to our full report.
Operating Margin
Cintas has been a well-oiled machine over the last five years. It demonstrated elite profitability for a business services business, boasting an average operating margin of 21.4%.
Looking at the trend in its profitability, Cintas’s operating margin rose by 3.4 percentage points over the last five years, as its sales growth gave it operating leverage.
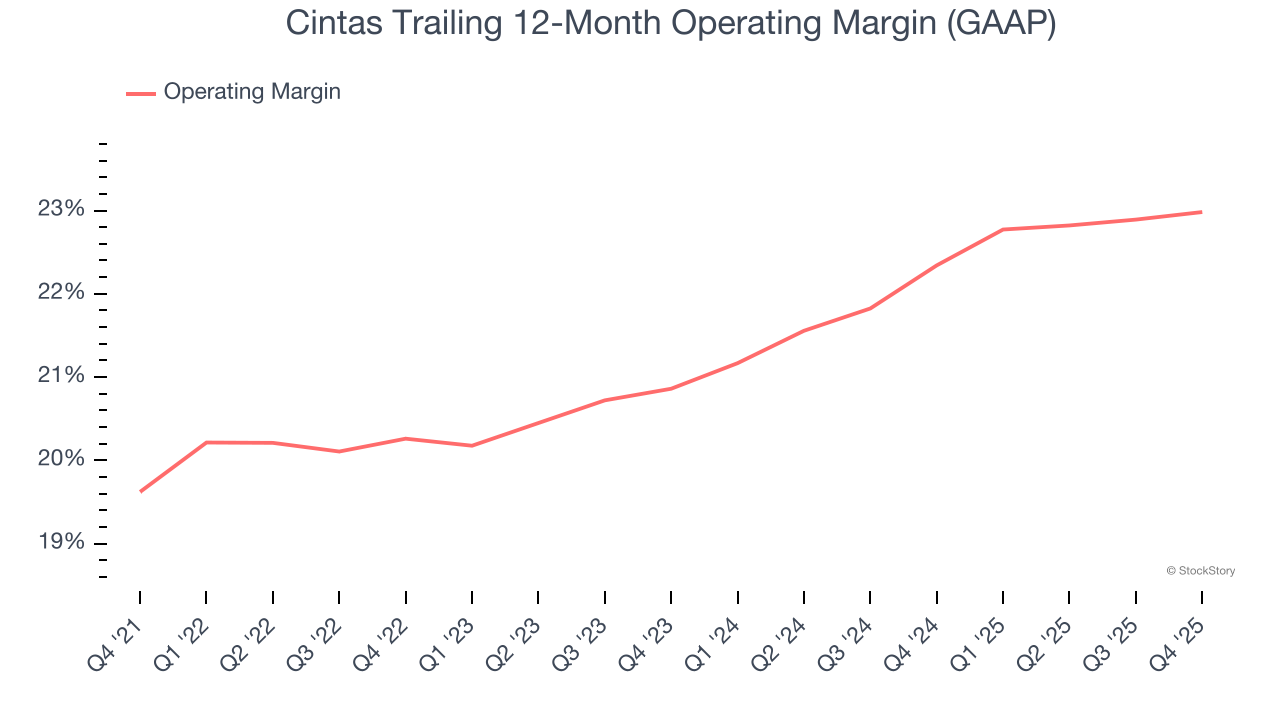
In Q4, Cintas generated an operating margin profit margin of 23.4%, in line with the same quarter last year. This indicates the company’s overall cost structure has been relatively stable.
Earnings Per Share
We track the long-term change in earnings per share (EPS) for the same reason as long-term revenue growth. Compared to revenue, however, EPS highlights whether a company’s growth is profitable.
Cintas’s EPS grew at an astounding 15.6% compounded annual growth rate over the last five years, higher than its 9.3% annualized revenue growth. This tells us the company became more profitable on a per-share basis as it expanded.
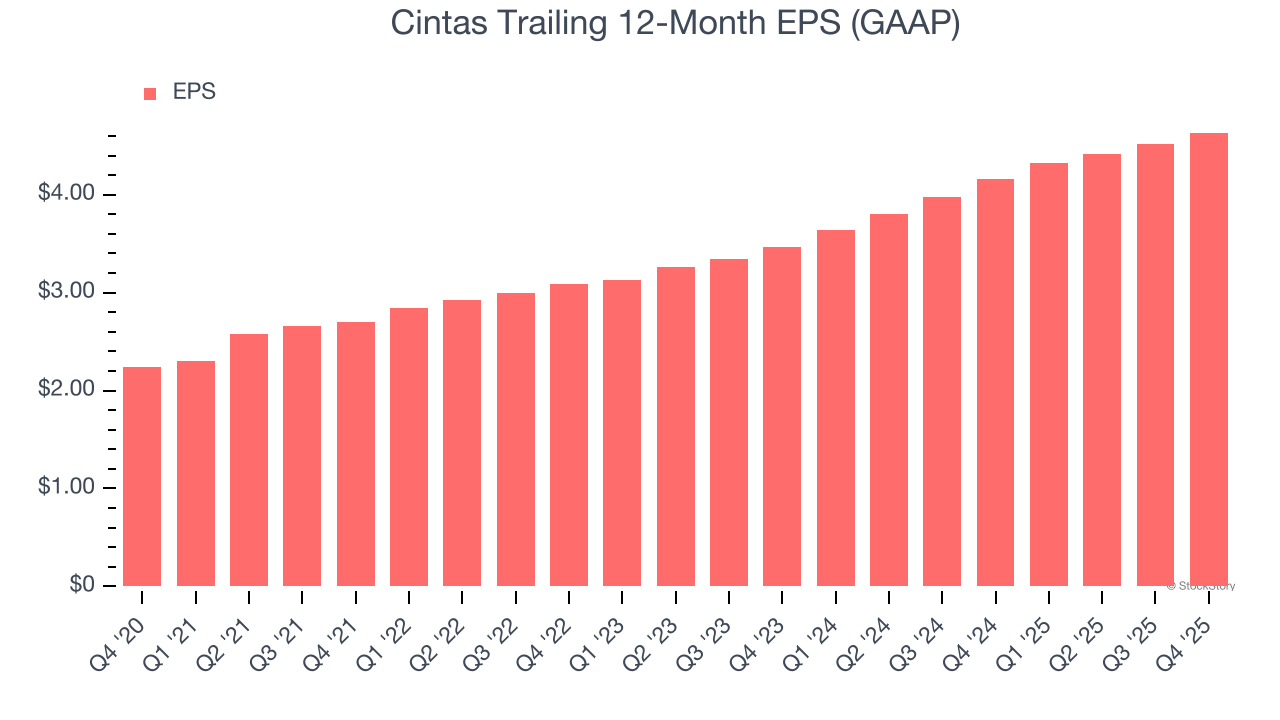
Diving into Cintas’s quality of earnings can give us a better understanding of its performance. As we mentioned earlier, Cintas’s operating margin was flat this quarter but expanded by 3.4 percentage points over the last five years. On top of that, its share count shrank by 5.9%. These are positive signs for shareholders because improving profitability and share buybacks turbocharge EPS growth relative to revenue growth. 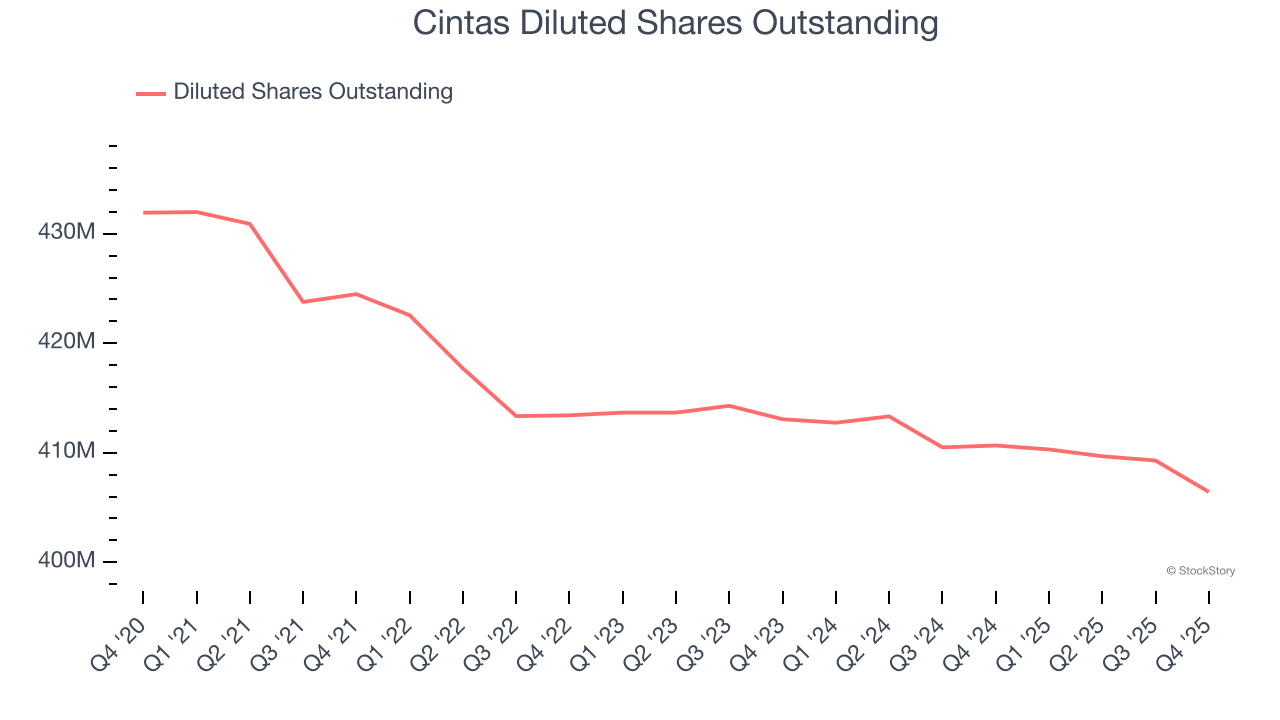
Like with revenue, we analyze EPS over a more recent period because it can provide insight into an emerging theme or development for the business.
For Cintas, its two-year annual EPS growth of 15.7% is similar to its five-year trend, implying strong and stable earnings power.
In Q4, Cintas reported EPS of $1.21, up from $1.09 in the same quarter last year. This print beat analysts’ estimates by 1.3%. Over the next 12 months, Wall Street expects Cintas’s full-year EPS of $4.63 to grow 10.3%.
Key Takeaways from Cintas’s Q4 Results
It was good to see Cintas narrowly top analysts’ revenue expectations this quarter. EPS also exceeded estimates. Overall, this print had some key positives. The stock remained flat at $188.42 immediately after reporting.
Should you buy the stock or not? When making that decision, it’s important to consider its valuation, business qualities, as well as what has happened in the latest quarter. We cover that in our actionable full research report which you can read here, it’s free for active Edge members.


