Over the last six months, Olaplex’s shares have sunk to $1.11, producing a disappointing 18.4% loss - a stark contrast to the S&P 500’s 14.1% gain. This may have investors wondering how to approach the situation.
Is now the time to buy Olaplex, or should you be careful about including it in your portfolio? Get the full stock story straight from our expert analysts, it’s free for active Edge members.
Why Is Olaplex Not Exciting?
Despite the more favorable entry price, we're cautious about Olaplex. Here are three reasons there are better opportunities than OLPX and a stock we'd rather own.
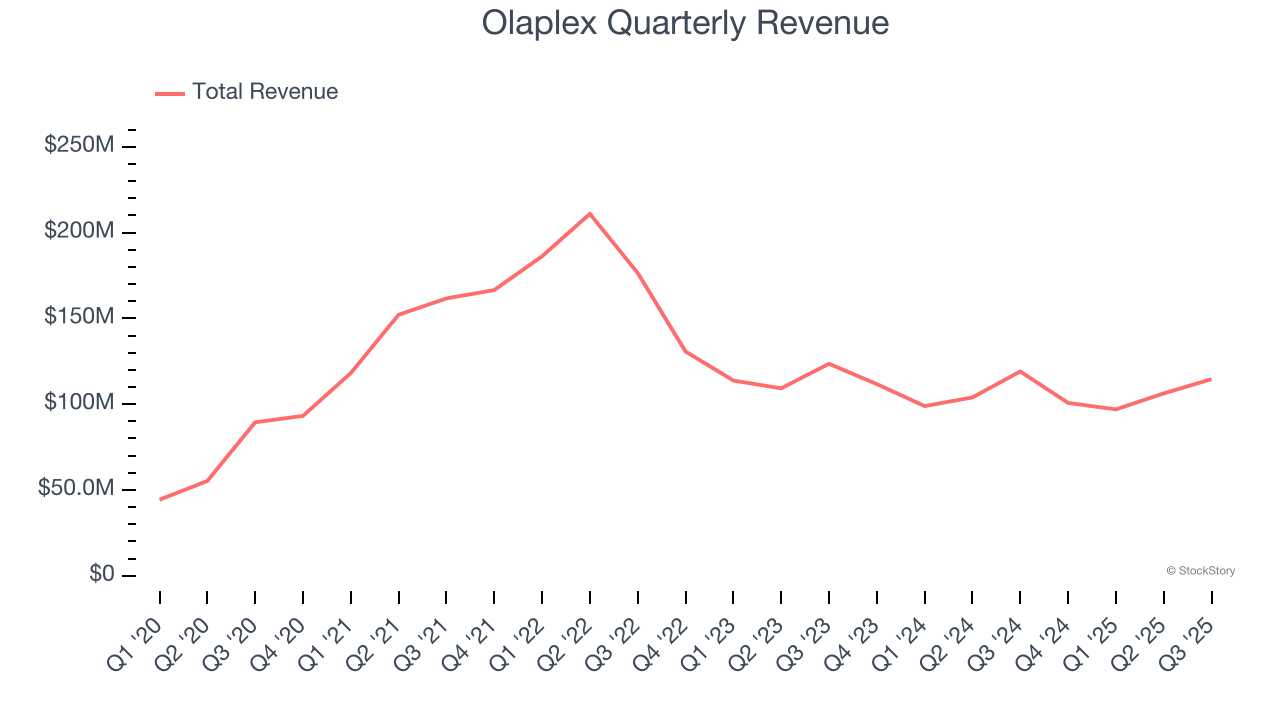
1. Revenue Spiraling Downwards
A company’s long-term sales performance can indicate its overall quality. Any business can put up a good quarter or two, but the best consistently grow over the long haul. Olaplex’s demand was weak over the last three years as its sales fell at a 17.3% annual rate. This wasn’t a great result and signals it’s a lower quality business.
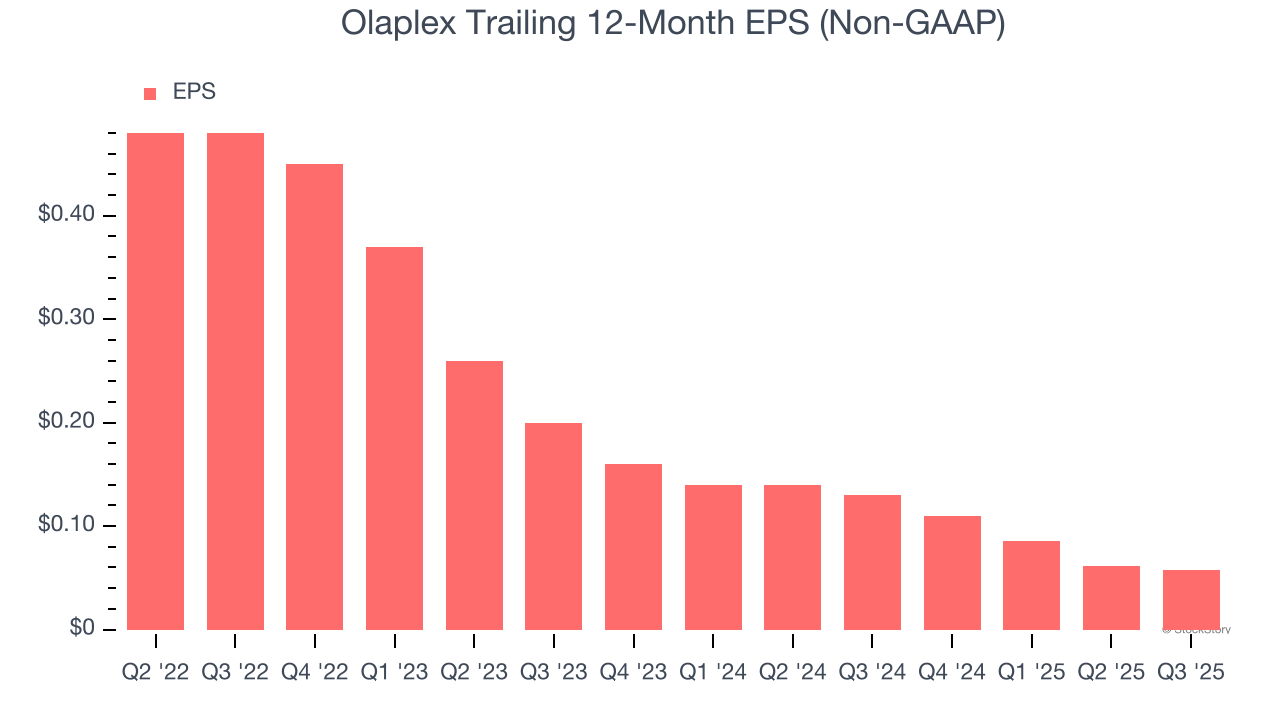
2. EPS Trending Down
Analyzing the change in earnings per share (EPS) shows whether a company's incremental sales were profitable – for example, revenue could be inflated through excessive spending on advertising and promotions.
Sadly for Olaplex, its EPS declined by 50.8% annually over the last three years, more than its revenue. This tells us the company struggled because its fixed cost base made it difficult to adjust to shrinking demand.
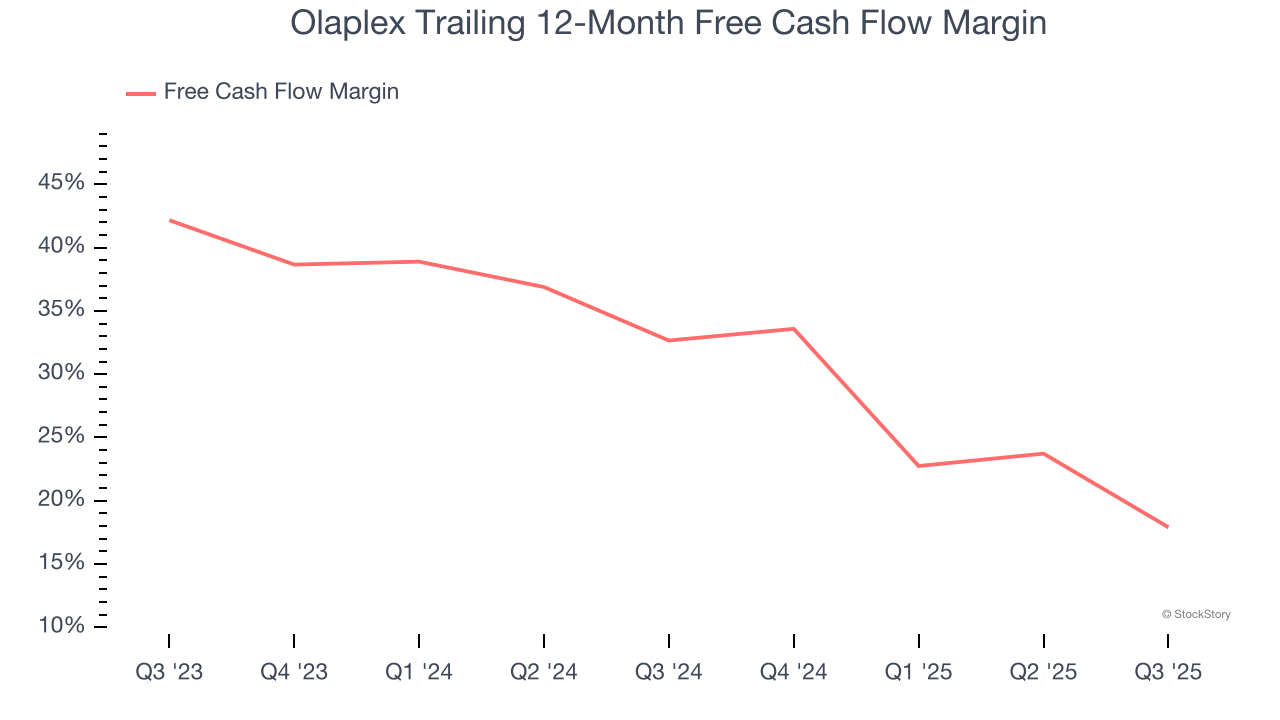
3. Free Cash Flow Margin Dropping
If you’ve followed StockStory for a while, you know we emphasize free cash flow. Why, you ask? We believe that in the end, cash is king, and you can’t use accounting profits to pay the bills.
As you can see below, Olaplex’s margin dropped by 14.7 percentage points over the last year. Continued declines could signal it is in the middle of an investment cycle. Olaplex’s free cash flow margin for the trailing 12 months was 17.9%.
Final Judgment
Olaplex isn’t a terrible business, but it doesn’t pass our bar. After the recent drawdown, the stock trades at 12.2× forward P/E (or $1.11 per share). This valuation is reasonable, but the company’s shakier fundamentals present too much downside risk. We're fairly confident there are better investments elsewhere. We’d suggest looking at one of Charlie Munger’s all-time favorite businesses.
Stocks We Would Buy Instead of Olaplex
Your portfolio can’t afford to be based on yesterday’s story. The risk in a handful of heavily crowded stocks is rising daily.
The names generating the next wave of massive growth are right here in our Top 9 Market-Beating Stocks. This is a curated list of our High Quality stocks that have generated a market-beating return of 244% over the last five years (as of June 30, 2025).
Stocks that have made our list include now familiar names such as Nvidia (+1,326% between June 2020 and June 2025) as well as under-the-radar businesses like the once-micro-cap company Tecnoglass (+1,754% five-year return). Find your next big winner with StockStory today.
StockStory is growing and hiring equity analyst and marketing roles. Are you a 0 to 1 builder passionate about the markets and AI? See the open roles here.