Women’s plus-size apparel retailer Torrid Holdings (NYSE: CURV) missed Wall Street’s revenue expectations in Q3 CY2025, with sales falling 10.8% year on year to $235.2 million. The company’s full-year revenue guidance of $998.5 million at the midpoint came in 2.2% below analysts’ estimates. Its GAAP loss of $0.06 per share was significantly below analysts’ consensus estimates.
Is now the time to buy Torrid? Find out by accessing our full research report, it’s free for active Edge members.
Torrid (CURV) Q3 CY2025 Highlights:
- Revenue: $235.2 million vs analyst estimates of $239.9 million (10.8% year-on-year decline, 2% miss)
- EPS (GAAP): -$0.06 vs analyst estimates of -$0.02 (significant miss)
- Adjusted EBITDA: $9.78 million vs analyst estimates of $18.33 million (4.2% margin, 46.7% miss)
- The company dropped its revenue guidance for the full year to $998.5 million at the midpoint from $1.02 billion, a 2.3% decrease
- EBITDA guidance for the full year is $60.5 million at the midpoint, below analyst estimates of $82.84 million
- Operating Margin: 0.1%, down from 2.7% in the same quarter last year
- Free Cash Flow was -$6.61 million compared to -$5.52 million in the same quarter last year
- Locations: 560 at quarter end, down from 655 in the same quarter last year
- Same-Store Sales fell 8% year on year (-6.5% in the same quarter last year)
- Market Capitalization: $130.9 million
Company Overview
Promoting a message of body positivity and inclusiveness, Torrid Holdings (NYSE: CURV) is a plus-size women’s apparel and accessories retailer.
Revenue Growth
Reviewing a company’s long-term sales performance reveals insights into its quality. Any business can have short-term success, but a top-tier one grows for years.
With $1.04 billion in revenue over the past 12 months, Torrid is a small retailer, which sometimes brings disadvantages compared to larger competitors benefiting from economies of scale and negotiating leverage with suppliers.
As you can see below, Torrid’s demand was weak over the last three years (we compare to 2019 to normalize for COVID-19 impacts). Its sales fell by 7.3% annually as it closed stores and observed lower sales at existing, established locations.
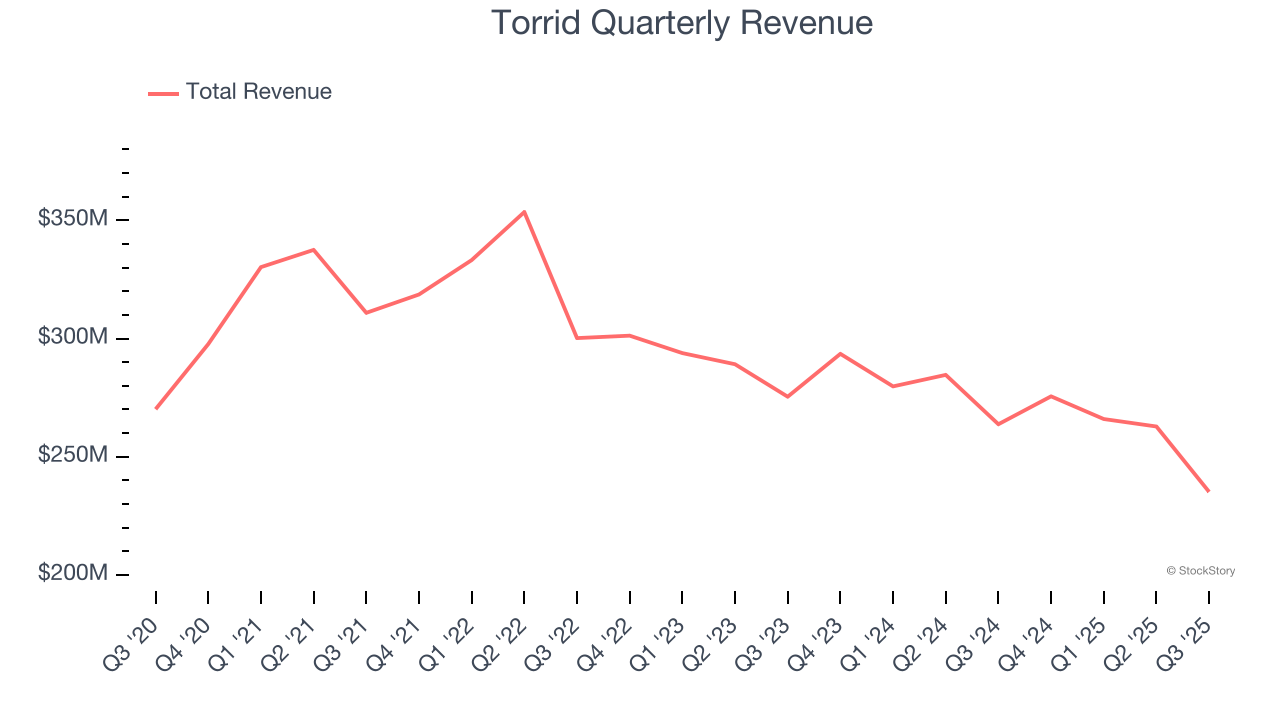
This quarter, Torrid missed Wall Street’s estimates and reported a rather uninspiring 10.8% year-on-year revenue decline, generating $235.2 million of revenue.
Looking ahead, sell-side analysts expect revenue to decline by 5.4% over the next 12 months. it’s hard to get excited about a company that is struggling with demand.
Microsoft, Alphabet, Coca-Cola, Monster Beverage—all began as under-the-radar growth stories riding a massive trend. We’ve identified the next one: a profitable AI semiconductor play Wall Street is still overlooking. Go here for access to our full report.
Store Performance
Number of Stores
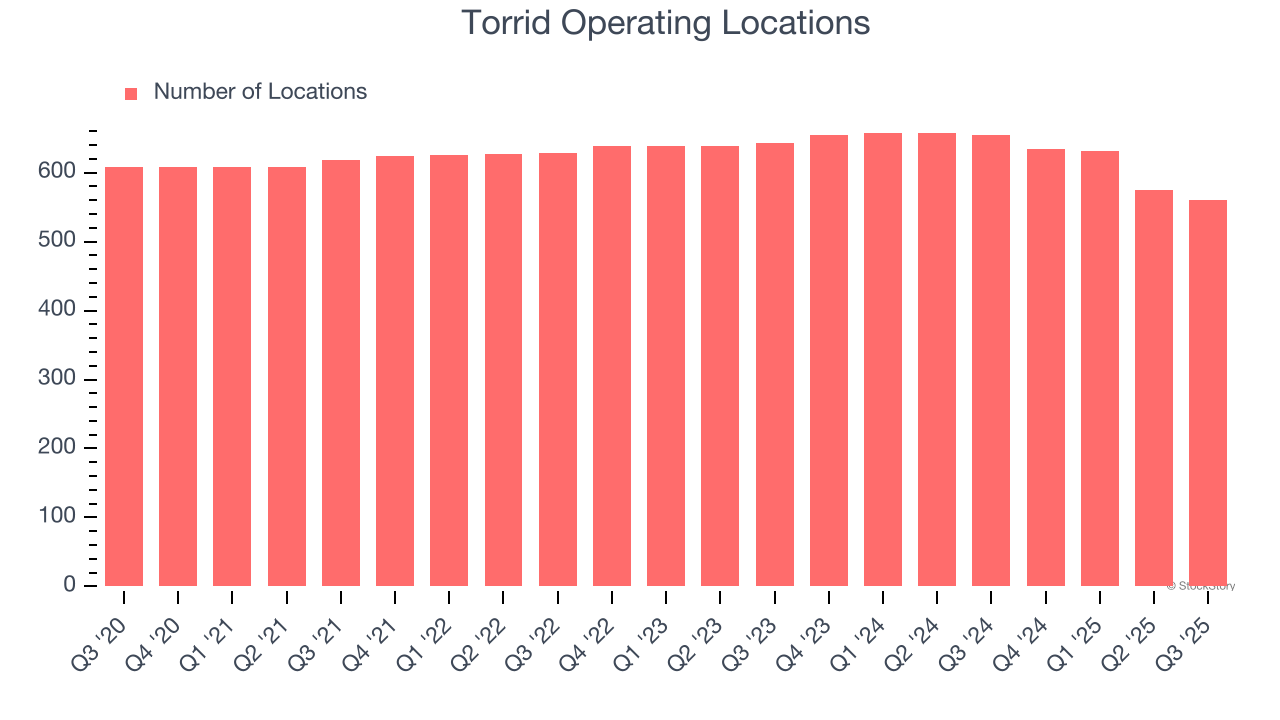
The number of stores a retailer operates is a critical driver of how quickly company-level sales can grow.
Torrid operated 560 locations in the latest quarter. Over the last two years, the company has generally closed its stores, averaging 3% annual declines.
When a retailer shutters stores, it usually means that brick-and-mortar demand is less than supply, and it is responding by closing underperforming locations to improve profitability.
Same-Store Sales
A company's store base only paints one part of the picture. When demand is high, it makes sense to open more. But when demand is low, it’s prudent to close some locations and use the money in other ways. Same-store sales gives us insight into this topic because it measures organic growth for a retailer's e-commerce platform and brick-and-mortar shops that have existed for at least a year.
Torrid’s demand has been shrinking over the last two years as its same-store sales have averaged 5.6% annual declines. This performance isn’t ideal, and Torrid is attempting to boost same-store sales by closing stores (fewer locations sometimes lead to higher same-store sales).
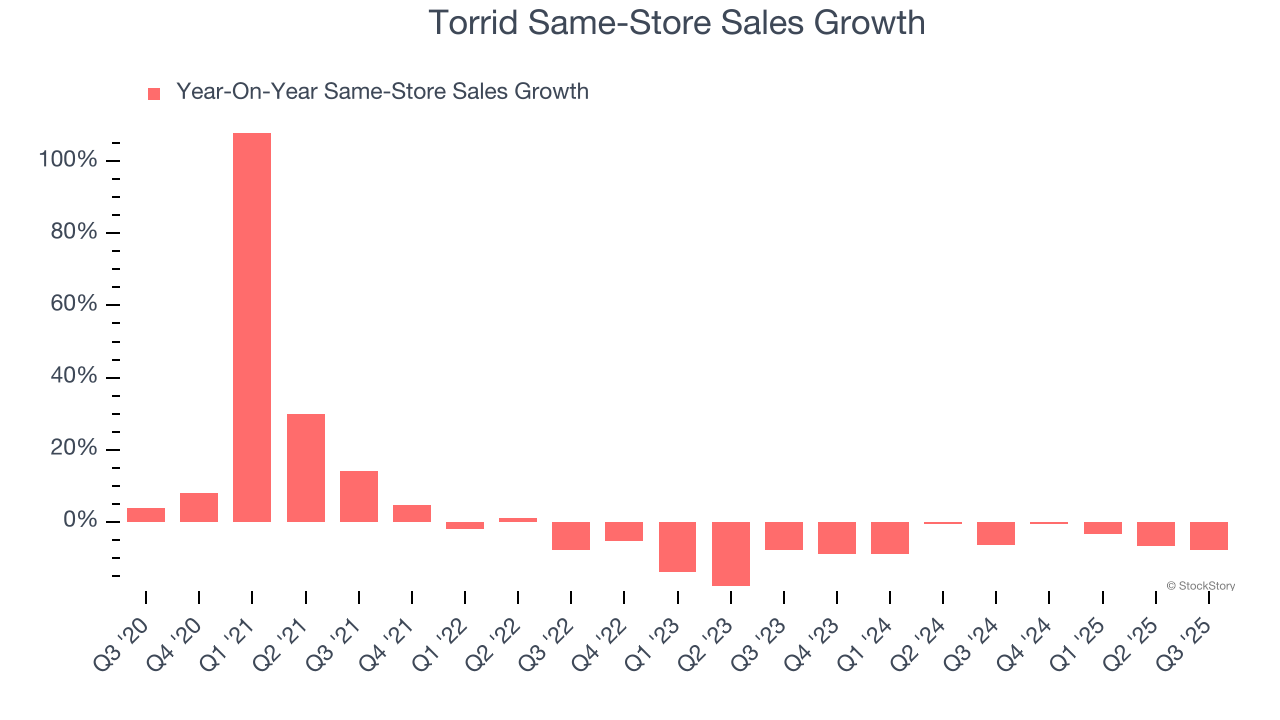
In the latest quarter, Torrid’s same-store sales fell by 8% year on year. This decrease represents a further deceleration from its historical levels. We hope the business can get back on track.
Key Takeaways from Torrid’s Q3 Results
We struggled to find many positives in these results. Its full-year EBITDA guidance missed and its EBITDA fell short of Wall Street’s estimates. Overall, this was a weaker quarter. The stock traded down 9.4% to $1.15 immediately after reporting.
Torrid didn’t show it’s best hand this quarter, but does that create an opportunity to buy the stock right now? When making that decision, it’s important to consider its valuation, business qualities, as well as what has happened in the latest quarter. We cover that in our actionable full research report which you can read here, it’s free for active Edge members.