The past six months have been a windfall for Sanmina’s shareholders. The company’s stock price has jumped 79.4%, hitting $157.78 per share. This was partly thanks to its solid quarterly results, and the performance may have investors wondering how to approach the situation.
Is now the time to buy Sanmina, or should you be careful about including it in your portfolio? Get the full stock story straight from our expert analysts, it’s free for active Edge members.
Why Is Sanmina Not Exciting?
We’re glad investors have benefited from the price increase, but we're cautious about Sanmina. Here are three reasons you should be careful with SANM and a stock we'd rather own.
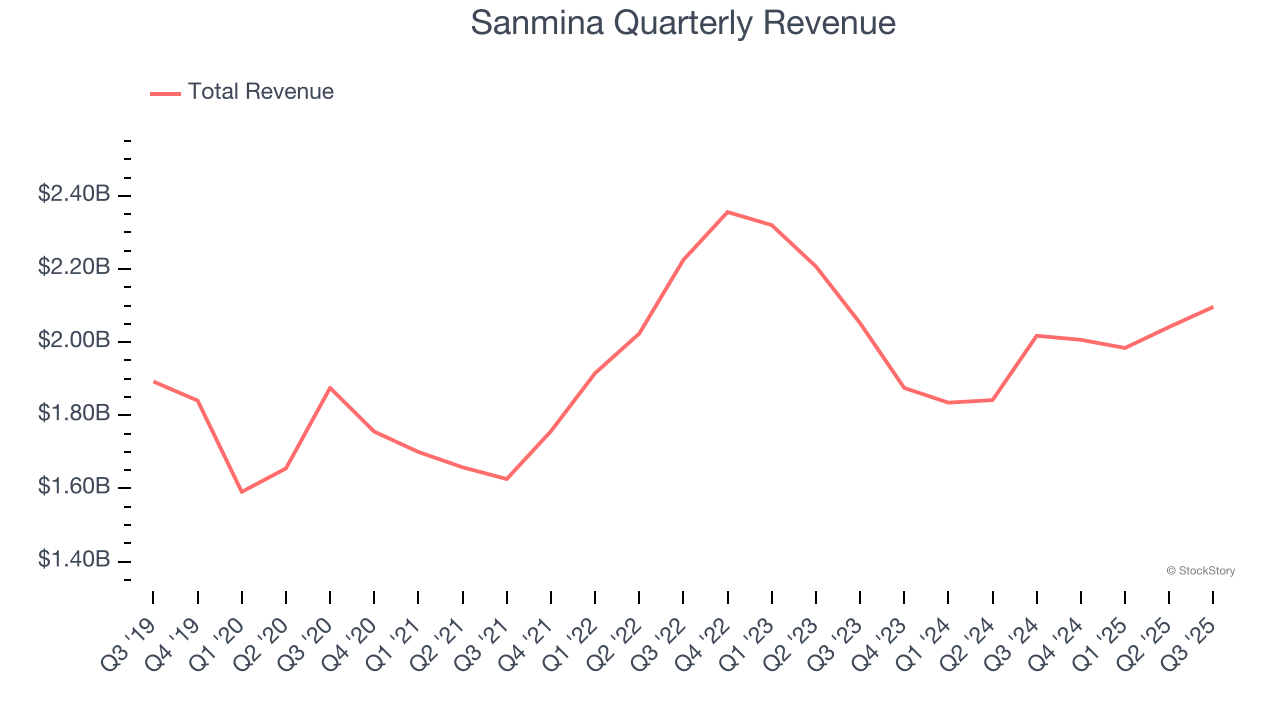
1. Long-Term Revenue Growth Disappoints
Examining a company’s long-term performance can provide clues about its quality. Any business can put up a good quarter or two, but many enduring ones grow for years. Unfortunately, Sanmina’s 3.2% annualized revenue growth over the last five years was sluggish. This fell short of our benchmark for the industrials sector.
2. Low Gross Margin Reveals Weak Structural Profitability
Gross profit margin is a critical metric to track because it sheds light on its pricing power, complexity of products, and ability to procure raw materials, equipment, and labor.
Sanmina has bad unit economics for an industrials business, signaling it operates in a competitive market. As you can see below, it averaged a 8.3% gross margin over the last five years. Said differently, Sanmina had to pay a chunky $91.73 to its suppliers for every $100 in revenue. 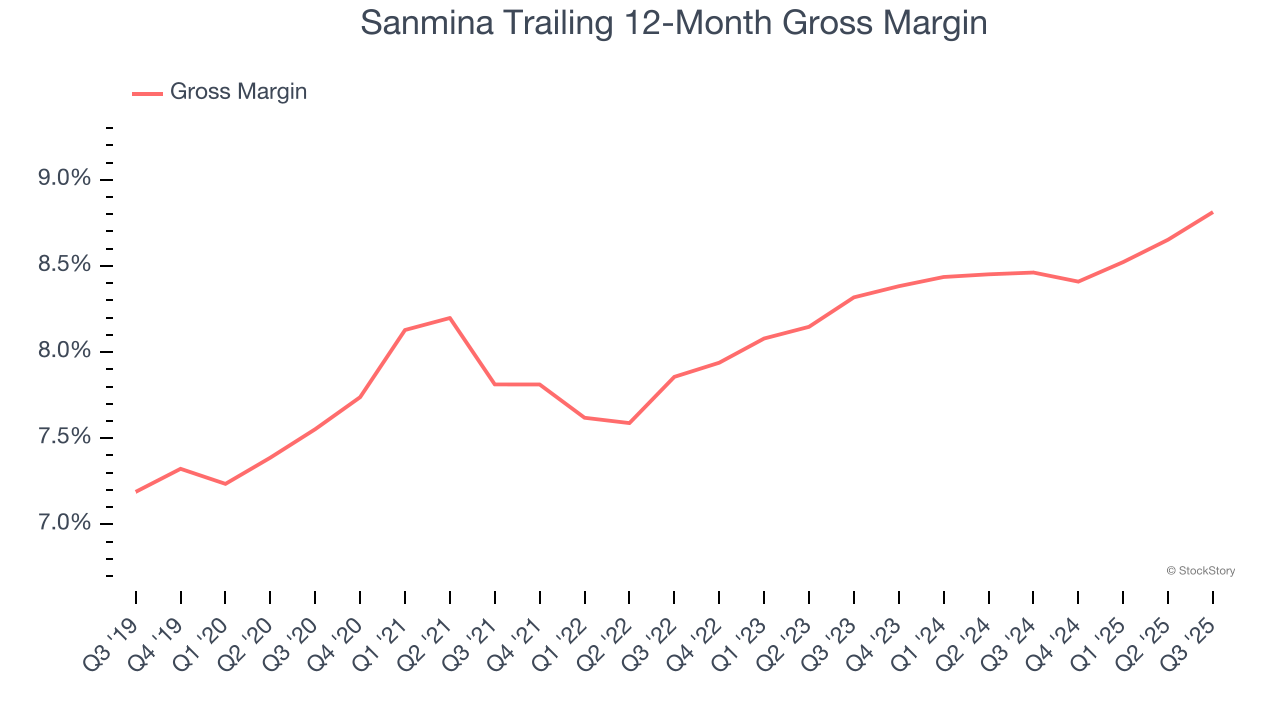
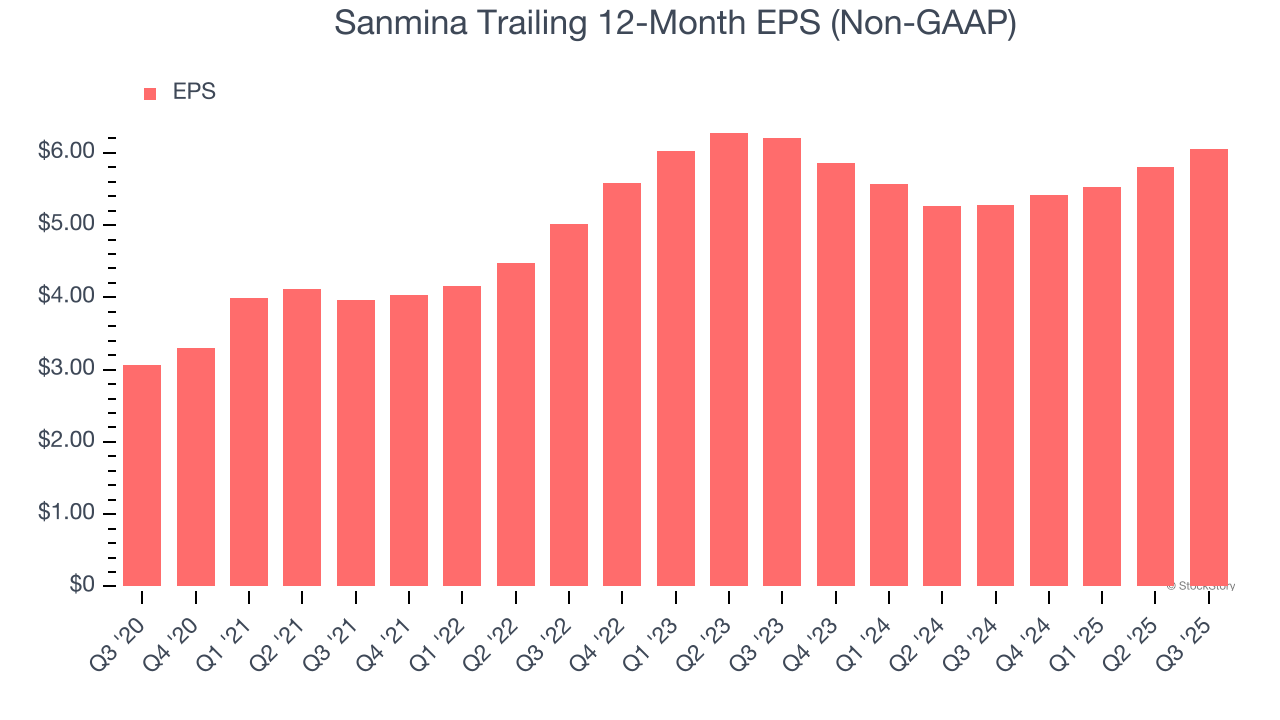
3. EPS Took a Dip Over the Last Two Years
While long-term earnings trends give us the big picture, we also track EPS over a shorter period because it can provide insight into an emerging theme or development for the business.
Sadly for Sanmina, its EPS and revenue declined by 1.2% and 4.6% annually over the last two years. We tend to steer our readers away from companies with falling revenue and EPS, where diminishing earnings could imply changing secular trends and preferences. If the tide turns unexpectedly, Sanmina’s low margin of safety could leave its stock price susceptible to large downswings.
Final Judgment
Sanmina’s business quality ultimately falls short of our standards. Following the recent rally, the stock trades at 16× forward P/E (or $157.78 per share). While this valuation is reasonable, we don’t really see a big opportunity at the moment. We're fairly confident there are better stocks to buy right now. We’d suggest looking at a fast-growing restaurant franchise with an A+ ranch dressing sauce.
Stocks We Like More Than Sanmina
If your portfolio success hinges on just 4 stocks, your wealth is built on fragile ground. You have a small window to secure high-quality assets before the market widens and these prices disappear.
Don’t wait for the next volatility shock. Check out our Top 9 Market-Beating Stocks. This is a curated list of our High Quality stocks that have generated a market-beating return of 244% over the last five years (as of June 30, 2025).
Stocks that have made our list include now familiar names such as Nvidia (+1,326% between June 2020 and June 2025) as well as under-the-radar businesses like the once-micro-cap company Tecnoglass (+1,754% five-year return). Find your next big winner with StockStory today.
StockStory is growing and hiring equity analyst and marketing roles. Are you a 0 to 1 builder passionate about the markets and AI? See the open roles here.