American firearms manufacturer Smith & Wesson (NASDAQ: SWBI) reported Q3 CY2025 results topping the market’s revenue expectations, but sales fell by 3.9% year on year to $124.7 million. Its non-GAAP profit of $0.04 per share was $0.02 above analysts’ consensus estimates.
Is now the time to buy Smith & Wesson? Find out by accessing our full research report, it’s free for active Edge members.
Smith & Wesson (SWBI) Q3 CY2025 Highlights:
- Revenue: $124.7 million vs analyst estimates of $123.7 million (3.9% year-on-year decline, 0.8% beat)
- Adjusted EPS: $0.04 vs analyst estimates of $0.02 ($0.02 beat)
- Adjusted EBITDA: $15.14 million vs analyst estimates of $12.02 million (12.1% margin, 26% beat)
- Operating Margin: 3.3%, down from 5.8% in the same quarter last year
- Free Cash Flow was $16.28 million, up from -$10.7 million in the same quarter last year
- Market Capitalization: $393.8 million
Company Overview
With a history dating back to 1852, Smith & Wesson (NASDAQ: SWBI) is a firearms manufacturer known for its handguns and rifles.
Revenue Growth
A company’s long-term performance is an indicator of its overall quality. Any business can put up a good quarter or two, but many enduring ones grow for years. Smith & Wesson struggled to consistently generate demand over the last five years as its sales dropped at a 10.2% annual rate. This wasn’t a great result and is a sign of poor business quality.
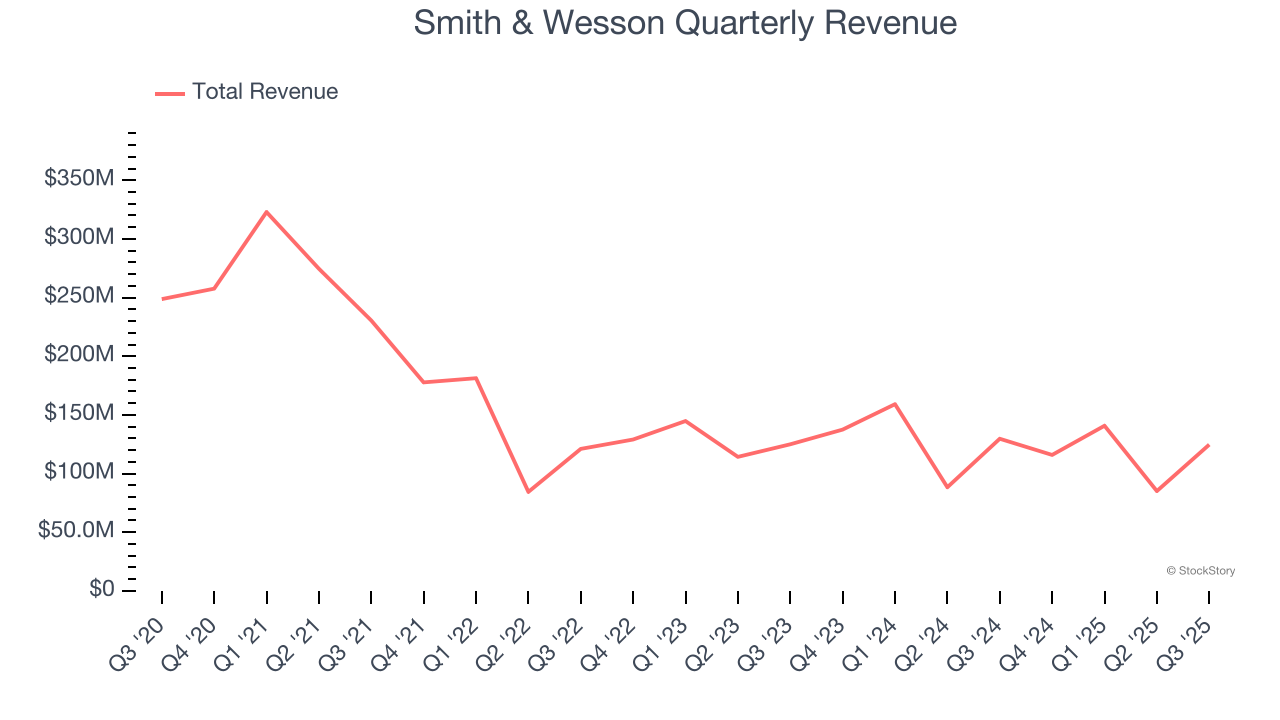
Long-term growth is the most important, but within consumer discretionary, product cycles are short and revenue can be hit-driven due to rapidly changing trends and consumer preferences. Smith & Wesson’s annualized revenue declines of 4.7% over the last two years suggest its demand continued shrinking. 
This quarter, Smith & Wesson’s revenue fell by 3.9% year on year to $124.7 million but beat Wall Street’s estimates by 0.8%.
Looking ahead, sell-side analysts expect revenue to remain flat over the next 12 months. Although this projection implies its newer products and services will spur better top-line performance, it is still below average for the sector.
Microsoft, Alphabet, Coca-Cola, Monster Beverage—all began as under-the-radar growth stories riding a massive trend. We’ve identified the next one: a profitable AI semiconductor play Wall Street is still overlooking. Go here for access to our full report.
Operating Margin
Smith & Wesson’s operating margin has been trending down over the last 12 months and averaged 6.5% over the last two years. The company’s profitability was mediocre for a consumer discretionary business and shows it couldn’t pass its higher operating expenses onto its customers.
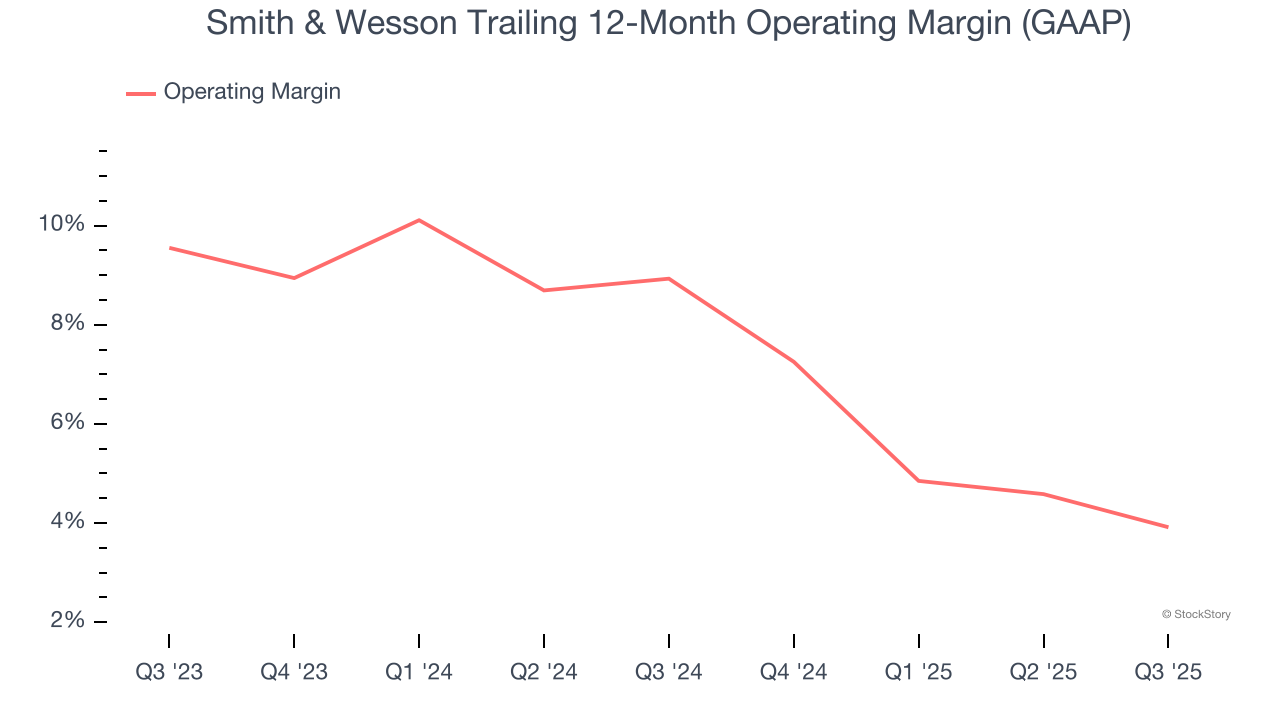
This quarter, Smith & Wesson generated an operating margin profit margin of 3.3%, down 2.5 percentage points year on year. This contraction shows it was less efficient because its expenses increased relative to its revenue.
Earnings Per Share
We track the long-term change in earnings per share (EPS) for the same reason as long-term revenue growth. Compared to revenue, however, EPS highlights whether a company’s growth is profitable.
Sadly for Smith & Wesson, its EPS declined by 41.4% annually over the last five years, more than its revenue. This tells us the company struggled because its fixed cost base made it difficult to adjust to shrinking demand.
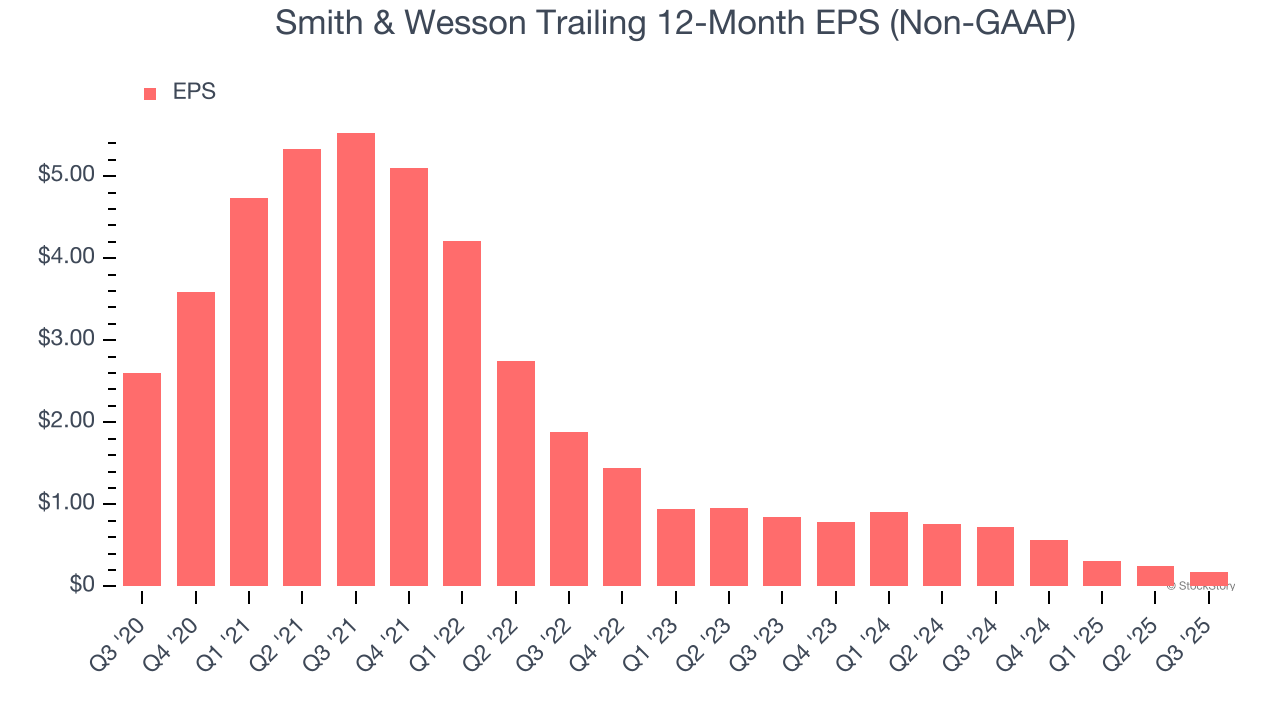
In Q3, Smith & Wesson reported adjusted EPS of $0.04, down from $0.11 in the same quarter last year. Despite falling year on year, this print easily cleared analysts’ estimates. Over the next 12 months, Wall Street expects Smith & Wesson’s full-year EPS of $0.18 to grow 25%.
Key Takeaways from Smith & Wesson’s Q3 Results
It was good to see Smith & Wesson beat analysts’ EPS expectations this quarter. We were also excited its EBITDA outperformed Wall Street’s estimates by a wide margin. Zooming out, we think this was a good print with some key areas of upside. The stock traded up 1.6% to $9.05 immediately following the results.
Smith & Wesson put up rock-solid earnings, but one quarter doesn’t necessarily make the stock a buy. Let’s see if this is a good investment. What happened in the latest quarter matters, but not as much as longer-term business quality and valuation, when deciding whether to invest in this stock. We cover that in our actionable full research report which you can read here, it’s free for active Edge members.