
Personalized clothing company Stitch Fix (NASDAQ: SFIX) reported Q3 CY2025 results beating Wall Street’s revenue expectations, with sales up 7.3% year on year to $342.1 million. On top of that, next quarter’s revenue guidance ($337.5 million at the midpoint) was surprisingly good and 9.6% above what analysts were expecting. Its GAAP loss of $0.05 per share was in line with analysts’ consensus estimates.
Is now the time to buy Stitch Fix? Find out by accessing our full research report, it’s free for active Edge members.
Stitch Fix (SFIX) Q3 CY2025 Highlights:
- Revenue: $342.1 million vs analyst estimates of $337.2 million (7.3% year-on-year growth, 1.5% beat)
- EPS (GAAP): -$0.05 vs analyst estimates of -$0.04 (in line)
- Adjusted EBITDA: $13.43 million vs analyst estimates of $10.1 million (3.9% margin, 33% beat)
- The company lifted its revenue guidance for the full year to $1.34 billion at the midpoint from $1.31 billion, a 2.3% increase
- EBITDA guidance for the full year is $43 million at the midpoint, above analyst estimates of $36.97 million
- Operating Margin: -2.5%, in line with the same quarter last year
- Free Cash Flow Margin: 1.6%, down from 3.1% in the same quarter last year
- Active Clients: 2.31 million, down 127,000 year on year
- Market Capitalization: $601.3 million
Company Overview
One of the original subscription box companies, Stitch Fix (NASDAQ: SFIX) is an online personal styling and fashion service that curates personalized clothing selections for customers.
Revenue Growth
Examining a company’s long-term performance can provide clues about its quality. Any business can put up a good quarter or two, but many enduring ones grow for years. Over the last five years, Stitch Fix’s demand was weak and its revenue declined by 6% per year. This wasn’t a great result and is a sign of poor business quality.
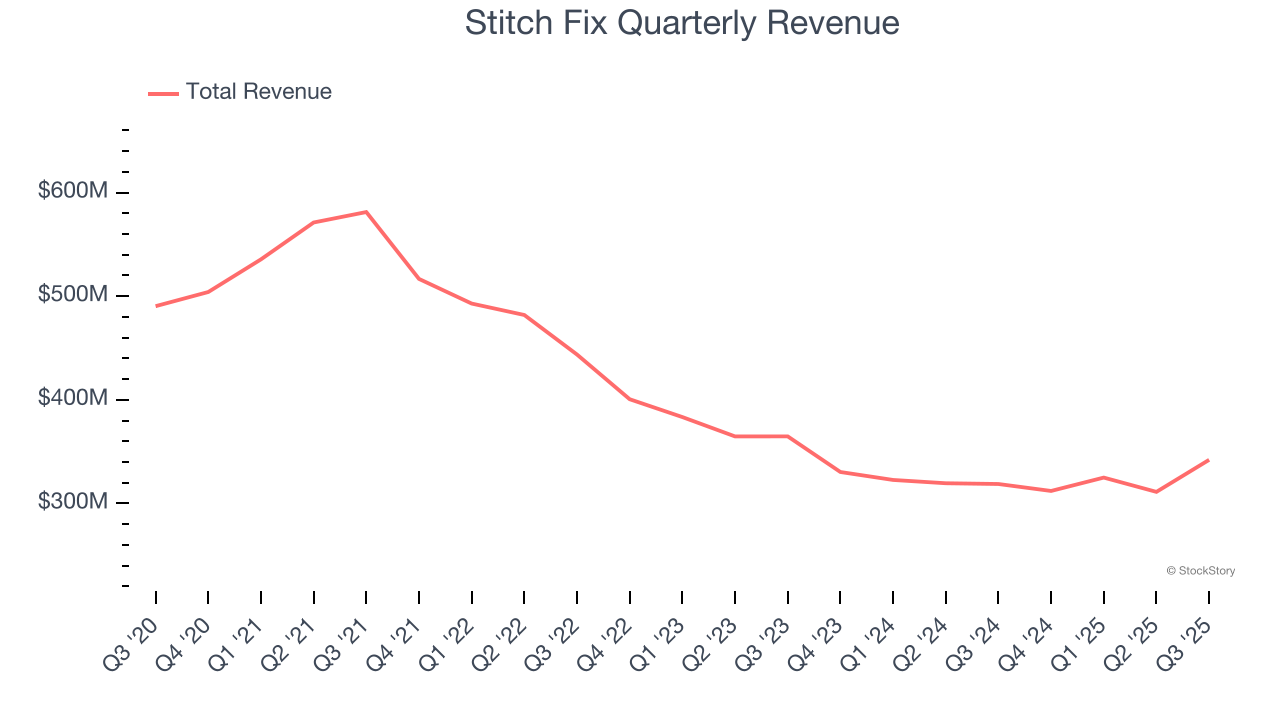
Long-term growth is the most important, but within consumer discretionary, product cycles are short and revenue can be hit-driven due to rapidly changing trends and consumer preferences. Stitch Fix’s recent performance shows its demand remained suppressed as its revenue has declined by 7.7% annually over the last two years. 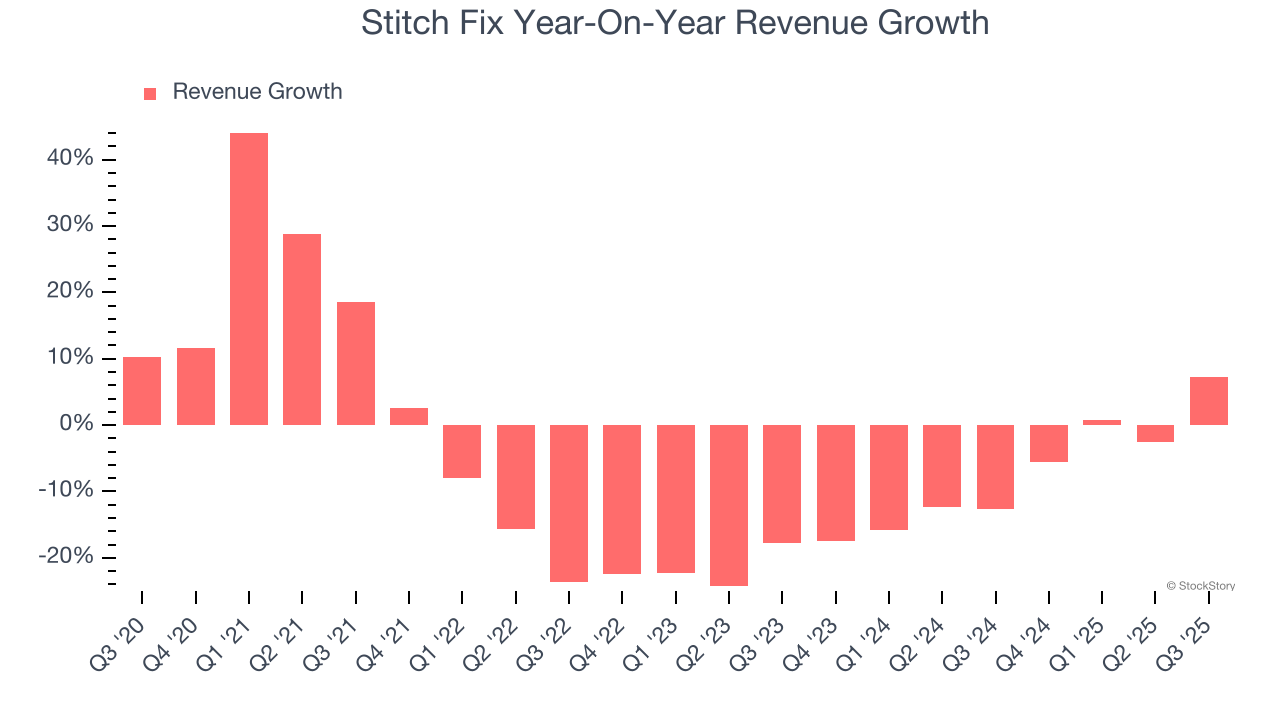
Stitch Fix also discloses its number of active clients, which reached 2.31 million in the latest quarter. Over the last two years, Stitch Fix’s active clients averaged 14.3% year-on-year declines. Because this number is lower than its revenue growth during the same period, we can see the company’s monetization has risen. 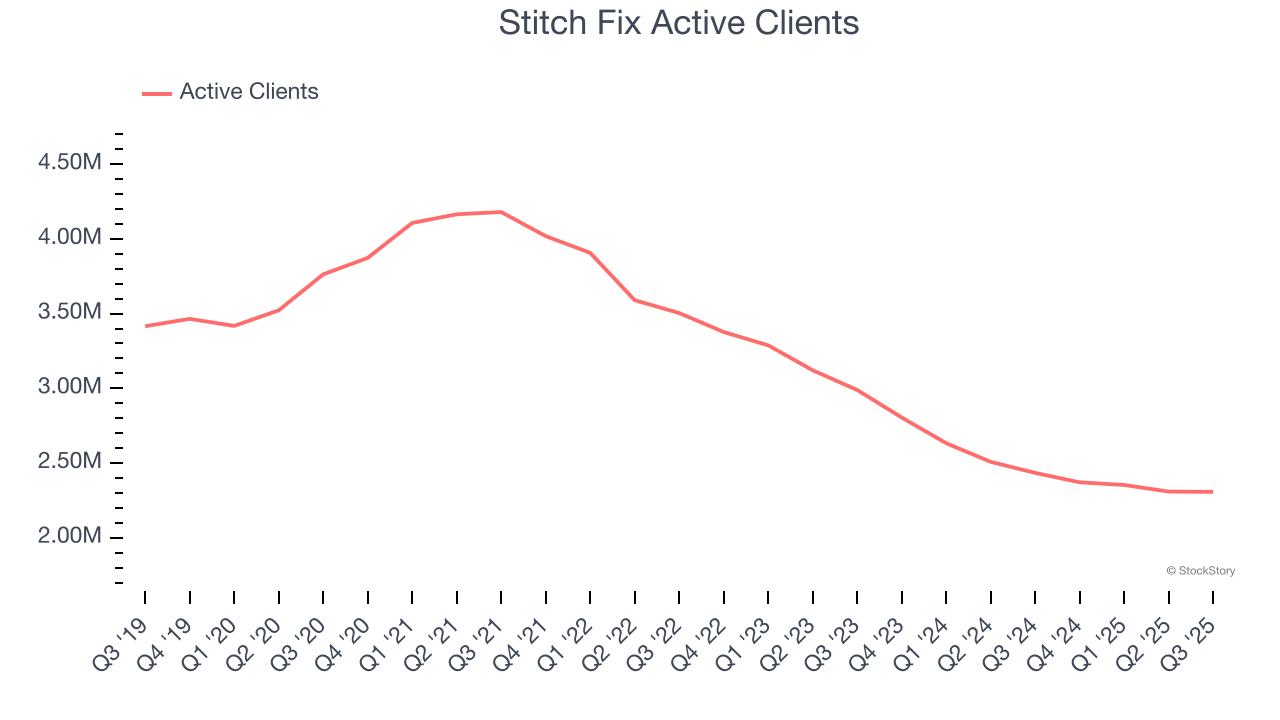
This quarter, Stitch Fix reported year-on-year revenue growth of 7.3%, and its $342.1 million of revenue exceeded Wall Street’s estimates by 1.5%. Company management is currently guiding for a 8.1% year-on-year increase in sales next quarter.
Looking further ahead, sell-side analysts expect revenue to grow 2.4% over the next 12 months. Although this projection suggests its newer products and services will fuel better top-line performance, it is still below average for the sector.
While Wall Street chases Nvidia at all-time highs, an under-the-radar semiconductor supplier is dominating a critical AI component these giants can’t build without. Click here to access our free report one of our favorites growth stories.
Operating Margin
Operating margin is a key measure of profitability. Think of it as net income - the bottom line - excluding the impact of taxes and interest on debt, which are less connected to business fundamentals.
Stitch Fix’s operating margin has risen over the last 12 months, but it still averaged negative 5.9% over the last two years. This is due to its large expense base and inefficient cost structure.
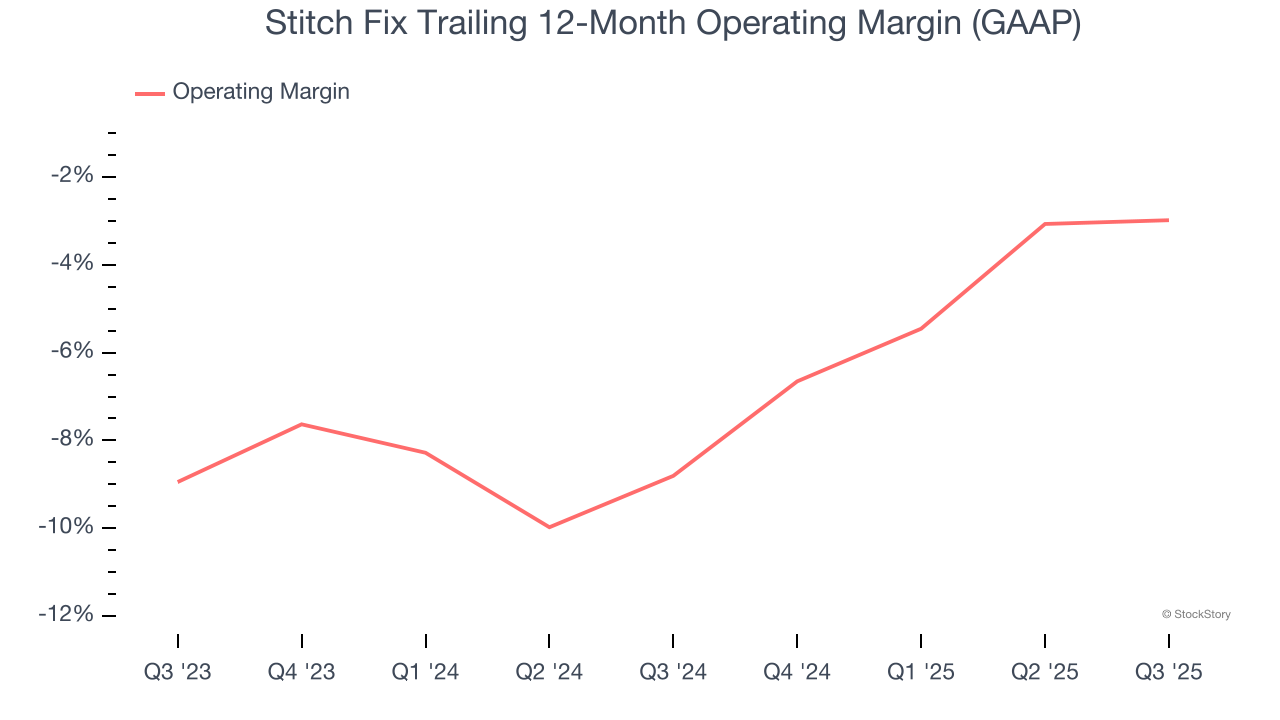
Stitch Fix’s operating margin was negative 2.5% this quarter. The company's consistent lack of profits raise a flag.
Earnings Per Share
We track the long-term change in earnings per share (EPS) for the same reason as long-term revenue growth. Compared to revenue, however, EPS highlights whether a company’s growth is profitable.
Although Stitch Fix’s full-year earnings are still negative, it reduced its losses and improved its EPS by 16.4% annually over the last five years. The next few quarters will be critical for assessing its long-term profitability.
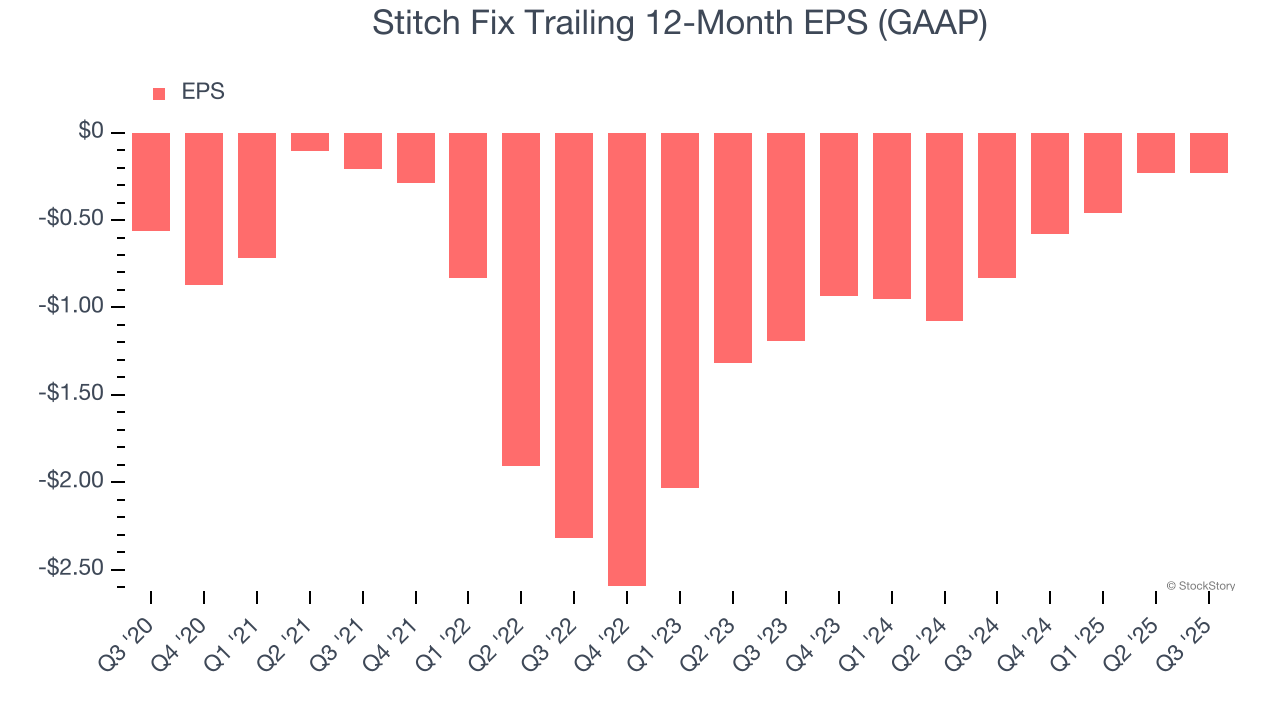
In Q3, Stitch Fix reported EPS of negative $0.05, in line with the same quarter last year. This print missed analysts’ estimates. Over the next 12 months, Wall Street expects Stitch Fix to improve its earnings losses. Analysts forecast its full-year EPS of negative $0.23 will advance to negative $0.17.
Key Takeaways from Stitch Fix’s Q3 Results
We were impressed by Stitch Fix’s optimistic EBITDA guidance for next quarter, which blew past analysts’ expectations. We were also excited its EBITDA outperformed Wall Street’s estimates by a wide margin. On the other hand, its EPS was in line. Zooming out, we think this was a solid print. The stock traded up 3.3% to $4.77 immediately following the results.
Sure, Stitch Fix had a solid quarter, but if we look at the bigger picture, is this stock a buy? When making that decision, it’s important to consider its valuation, business qualities, as well as what has happened in the latest quarter. We cover that in our actionable full research report which you can read here, it’s free for active Edge members.


