
Clothing and footwear retailer Zumiez (NASDAQ: ZUMZ) beat Wall Street’s revenue expectations in Q3 CY2025, with sales up 7.5% year on year to $239.1 million. Guidance for next quarter’s revenue was optimistic at $293.5 million at the midpoint, 2.7% above analysts’ estimates. Its GAAP profit of $0.55 per share was significantly above analysts’ consensus estimates.
Is now the time to buy Zumiez? Find out by accessing our full research report, it’s free for active Edge members.
Zumiez (ZUMZ) Q3 CY2025 Highlights:
- Revenue: $239.1 million vs analyst estimates of $234.4 million (7.5% year-on-year growth, 2% beat)
- EPS (GAAP): $0.55 vs analyst estimates of $0.27 (significant beat)
- Adjusted EBITDA: $13.44 million vs analyst estimates of $11.45 million (5.6% margin, 17.4% beat)
- Revenue Guidance for Q4 CY2025 is $293.5 million at the midpoint, above analyst estimates of $285.9 million
- EPS (GAAP) guidance for Q4 CY2025 is $1.02 at the midpoint, beating analyst estimates by 4.8%
- Operating Margin: 4.9%, up from 1.1% in the same quarter last year
- Free Cash Flow was $3.09 million, up from -$22.31 million in the same quarter last year
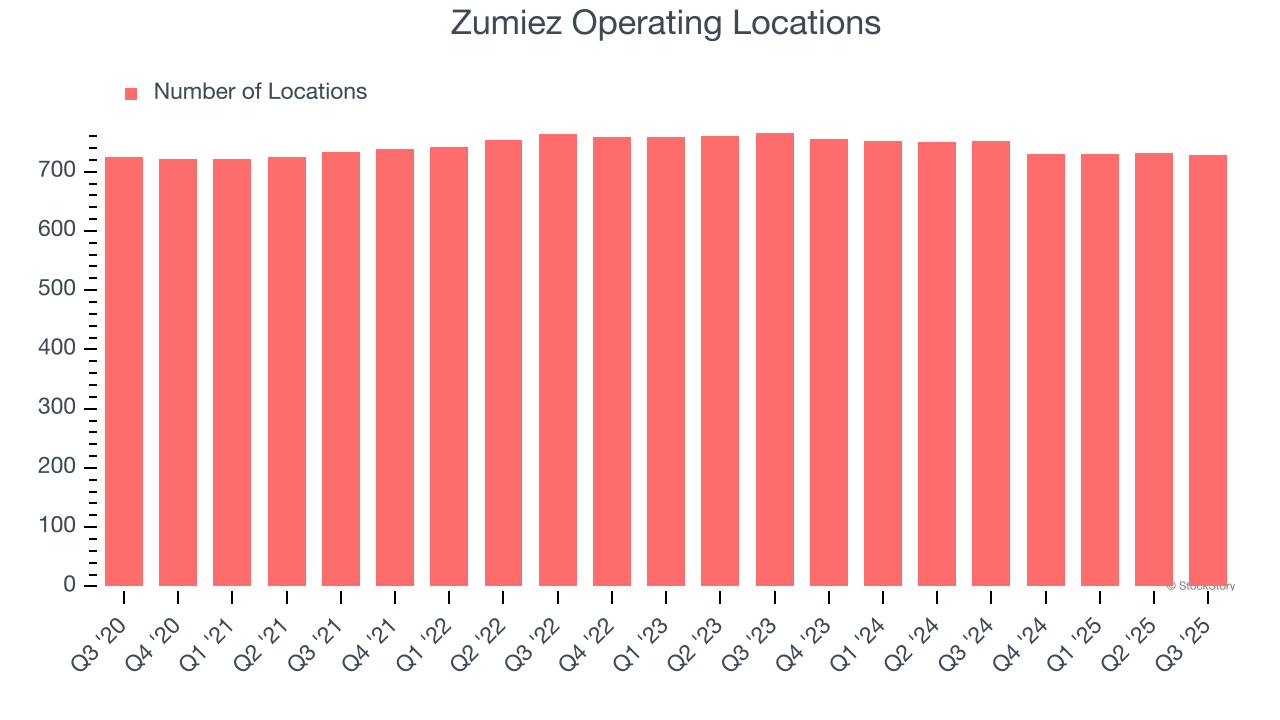
- Locations: 728 at quarter end, down from 752 in the same quarter last year
- Same-Store Sales rose 7.6% year on year, in line with the same quarter last year
- Market Capitalization: $476 million
“We achieved our best third quarter in several years,” said Rick Brooks, Chief Executive Officer of Zumiez Inc.
Company Overview
With store associates called “Zumiez Stash Members”, Zumiez (NASDAQ: ZUMZ) is a specialty retailer of street and skate apparel, footwear, and accessories.
Revenue Growth
A company’s long-term sales performance is one signal of its overall quality. Any business can put up a good quarter or two, but many enduring ones grow for years.
With $916.9 million in revenue over the past 12 months, Zumiez is a small retailer, which sometimes brings disadvantages compared to larger competitors benefiting from economies of scale and negotiating leverage with suppliers.
As you can see below, Zumiez’s revenue declined by 3.6% per year over the last three years (we compare to 2019 to normalize for COVID-19 impacts) as it closed stores.
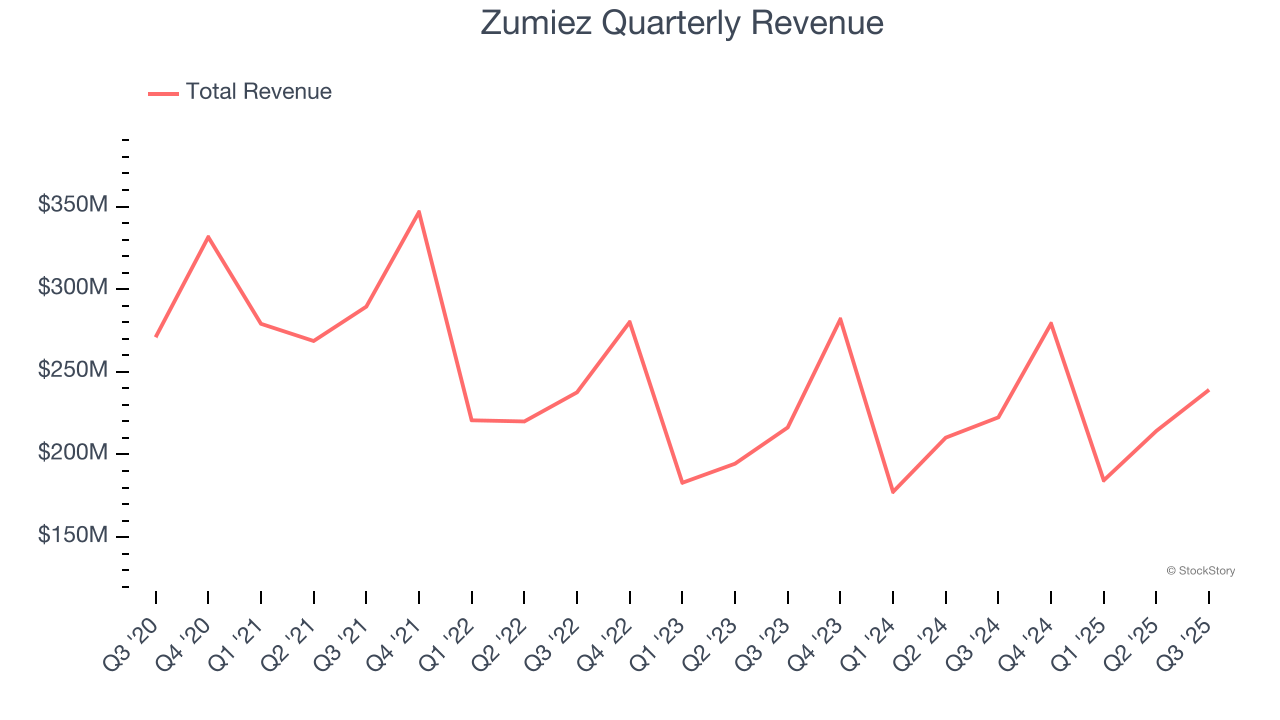
This quarter, Zumiez reported year-on-year revenue growth of 7.5%, and its $239.1 million of revenue exceeded Wall Street’s estimates by 2%. Company management is currently guiding for a 5.1% year-on-year increase in sales next quarter.
Looking further ahead, sell-side analysts expect revenue to grow 1.1% over the next 12 months. Although this projection suggests its newer products will fuel better top-line performance, it is still below average for the sector.
Software is eating the world and there is virtually no industry left that has been untouched by it. That drives increasing demand for tools helping software developers do their jobs, whether it be monitoring critical cloud infrastructure, integrating audio and video functionality, or ensuring smooth content streaming. Click here to access a free report on our 3 favorite stocks to play this generational megatrend.
Store Performance
Number of Stores
A retailer’s store count influences how much it can sell and how quickly revenue can grow.
Zumiez operated 728 locations in the latest quarter. Over the last two years, the company has generally closed its stores, averaging 2.1% annual declines.
When a retailer shutters stores, it usually means that brick-and-mortar demand is less than supply, and it is responding by closing underperforming locations to improve profitability.
Same-Store Sales
The change in a company's store base only tells one side of the story. The other is the performance of its existing locations and e-commerce sales, which informs management teams whether they should expand or downsize their physical footprints. Same-store sales gives us insight into this topic because it measures organic growth for a retailer's e-commerce platform and brick-and-mortar shops that have existed for at least a year.
Zumiez’s demand has been spectacular for a retailer over the last two years. On average, the company has increased its same-store sales by an impressive 3.3% per year. Given its declining store base over the same period, this performance stems from a mixture of higher e-commerce sales and increased foot traffic at existing locations (closing stores can sometimes boost same-store sales).
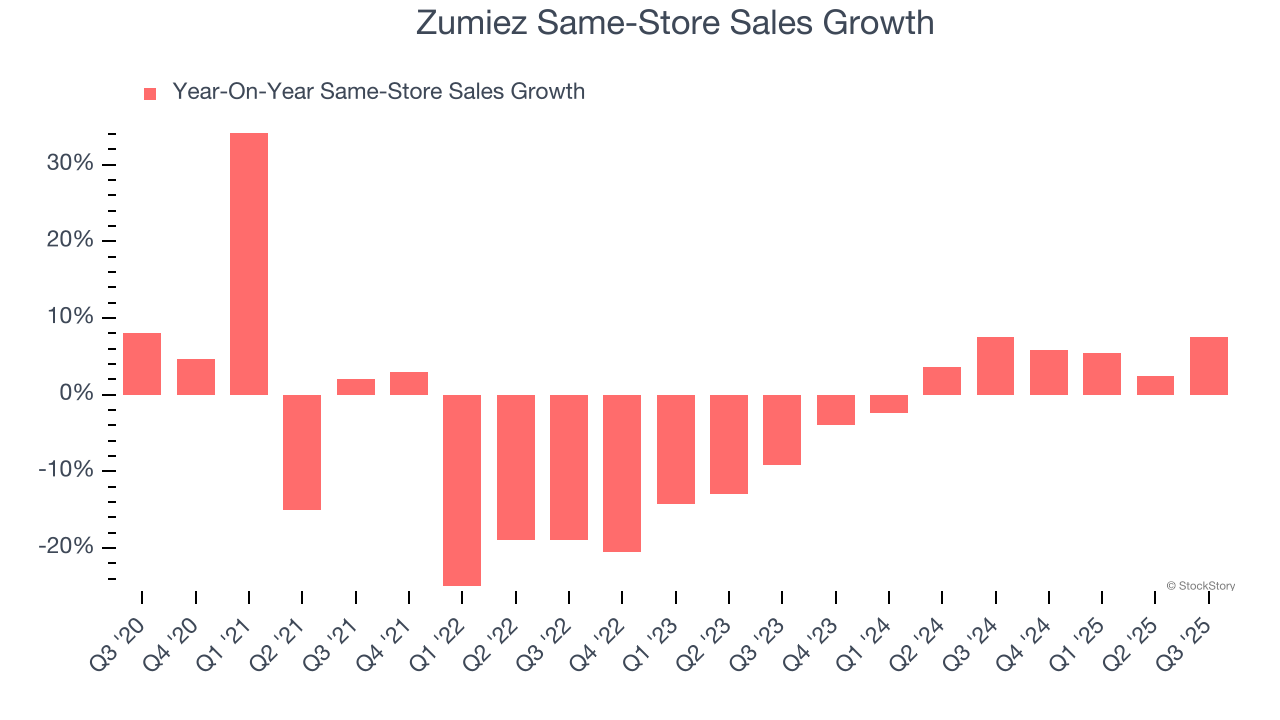
In the latest quarter, Zumiez’s same-store sales rose 7.6% year on year. This growth was an acceleration from its historical levels, which is always an encouraging sign.
Key Takeaways from Zumiez’s Q3 Results
It was good to see Zumiez beat analysts’ EPS expectations this quarter. We were also excited its EBITDA outperformed Wall Street’s estimates by a wide margin. Zooming out, we think this was a solid print. The stock traded up 4.3% to $28.46 immediately following the results.
Zumiez put up rock-solid earnings, but one quarter doesn’t necessarily make the stock a buy. Let’s see if this is a good investment. If you’re making that decision, you should consider the bigger picture of valuation, business qualities, as well as the latest earnings. We cover that in our actionable full research report which you can read here, it’s free for active Edge members.


