ETFOptimize | High-performance ETF-based Investment Strategies

Quantitative strategies, Wall Street-caliber research, and insightful market analysis since 1998.


ETFOptimize | HOME
Close Window

2 Reasons TROW is Risky and 1 Stock to Buy Instead

TROW Cover Image

T. Rowe Price trades at $105.62 per share and has stayed right on track with the overall market, gaining 13.3% over the last six months. At the same time, the S&P 500 has returned 15.3%.

Is there a buying opportunity in T. Rowe Price, or does it present a risk to your portfolio? See what our analysts have to say in our full research report, it’s free for active Edge members.

Why Is T. Rowe Price Not Exciting?

We're sitting this one out for now. Here are two reasons there are better opportunities than TROW and a stock we'd rather own.

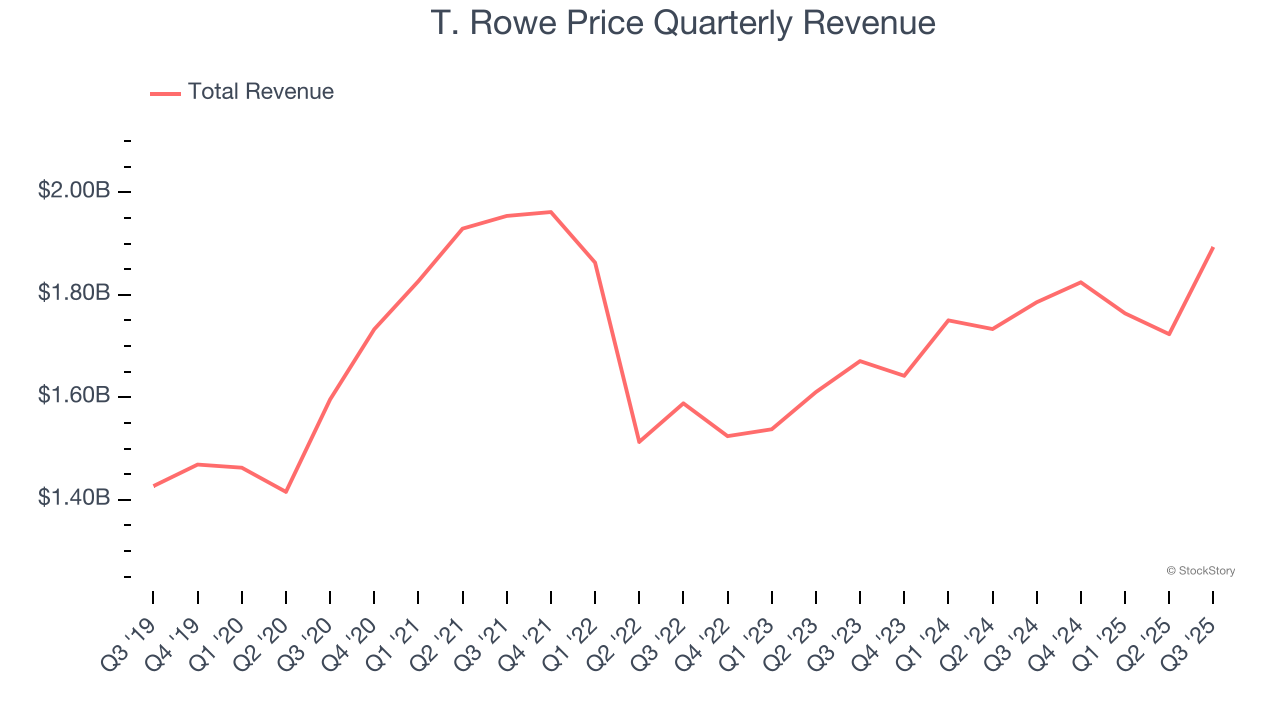
1. Long-Term Revenue Growth Disappoints

Examining a company’s long-term performance can provide clues about its quality. Any business can have short-term success, but a top-tier one grows for years.

Unfortunately, T. Rowe Price’s 3.9% annualized revenue growth over the last five years was sluggish. This fell short of our benchmark for the financials sector.

T. Rowe Price Quarterly Revenue

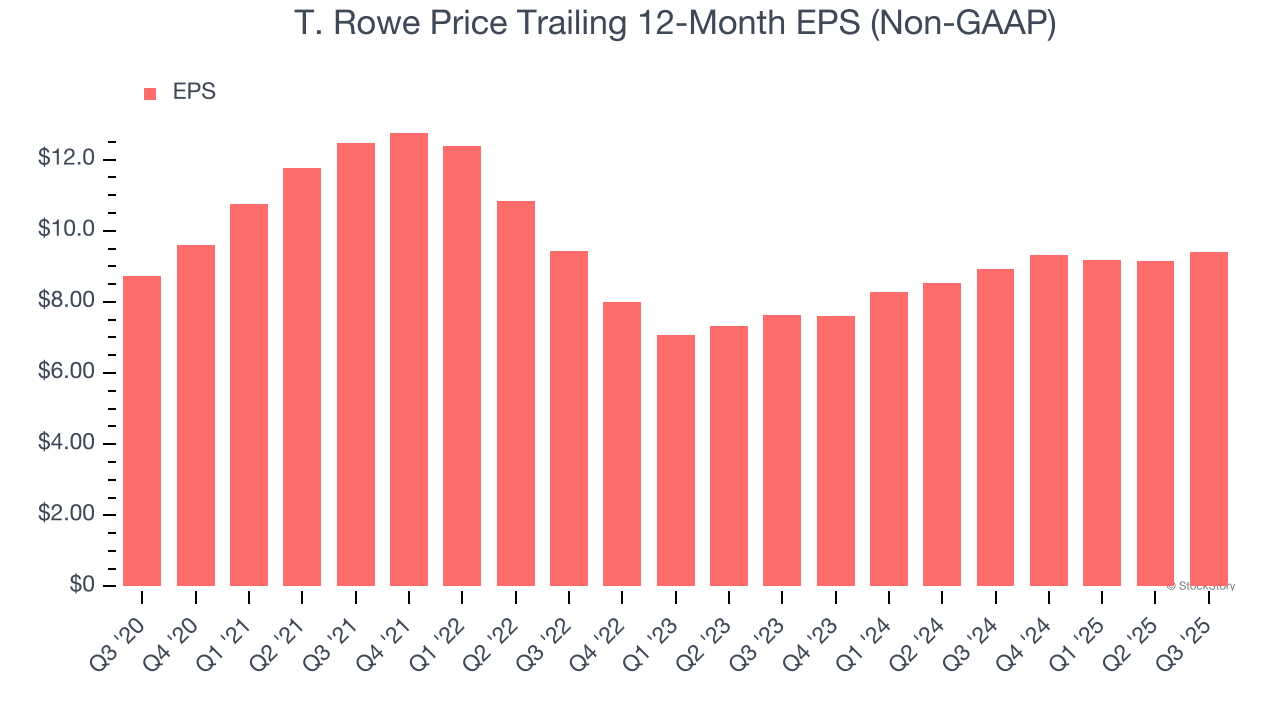
2. EPS Barely Growing

We track the long-term change in earnings per share (EPS) because it highlights whether a company’s growth is profitable.

T. Rowe Price’s EPS grew at a weak 1.5% compounded annual growth rate over the last five years, lower than its 3.9% annualized revenue growth. This tells us the company became less profitable on a per-share basis as it expanded.

T. Rowe Price Trailing 12-Month EPS (Non-GAAP)

Final Judgment

T. Rowe Price isn’t a terrible business, but it isn’t one of our picks. That said, the stock currently trades at 10.2× forward P/E (or $105.62 per share). While this valuation is reasonable, we don’t really see a big opportunity at the moment. We're pretty confident there are superior stocks to buy right now. We’d recommend looking at one of our all-time favorite software stocks.

High-Quality Stocks for All Market Conditions

The market’s up big this year - but there’s a catch. Just 4 stocks account for half the S&P 500’s entire gain. That kind of concentration makes investors nervous, and for good reason. While everyone piles into the same crowded names, smart investors are hunting quality where no one’s looking - and paying a fraction of the price. Check out the high-quality names we’ve flagged in our Top 9 Market-Beating Stocks. This is a curated list of our High Quality stocks that have generated a market-beating return of 244% over the last five years (as of June 30, 2025).

Stocks that have made our list include now familiar names such as Nvidia (+1,326% between June 2020 and June 2025) as well as under-the-radar businesses like the once-small-cap company Comfort Systems (+782% five-year return). Find your next big winner with StockStory today.

StockStory is growing and hiring equity analyst and marketing roles. Are you a 0 to 1 builder passionate about the markets and AI? See the open roles here.

Recent Quotes

View More
Symbol Price Change (%)
AMZN  229.53
+0.42 (0.18%)
AAPL  278.78
-1.92 (-0.68%)
AMD  217.97
+1.99 (0.92%)
BAC  53.95
+0.07 (0.13%)
GOOG  322.09
+3.70 (1.16%)
META  673.42
+11.89 (1.80%)
MSFT  483.16
+2.32 (0.48%)
NVDA  182.41
-0.97 (-0.53%)
ORCL  217.58
+3.25 (1.52%)
TSLA  455.00
+0.47 (0.10%)
Stock Quote API & Stock News API supplied by www.cloudquote.io
Quotes delayed at least 20 minutes.
By accessing this page, you agree to the Privacy Policy and Terms Of Service.


IntelligentValue Home
Close Window

DISCLAIMER

All content herein is issued solely for informational purposes and is not to be construed as an offer to sell or the solicitation of an offer to buy, nor should it be interpreted as a recommendation to buy, hold or sell (short or otherwise) any security.  All opinions, analyses, and information included herein are based on sources believed to be reliable, but no representation or warranty of any kind, expressed or implied, is made including but not limited to any representation or warranty concerning accuracy, completeness, correctness, timeliness or appropriateness. We undertake no obligation to update such opinions, analysis or information. You should independently verify all information contained on this website. Some information is based on analysis of past performance or hypothetical performance results, which have inherent limitations. We make no representation that any particular equity or strategy will or is likely to achieve profits or losses similar to those shown. Shareholders, employees, writers, contractors, and affiliates associated with ETFOptimize.com may have ownership positions in the securities that are mentioned. If you are not sure if ETFs, algorithmic investing, or a particular investment is right for you, you are urged to consult with a Registered Investment Advisor (RIA). Neither this website nor anyone associated with producing its content are Registered Investment Advisors, and no attempt is made herein to substitute for personalized, professional investment advice. Neither ETFOptimize.com, Global Alpha Investments, Inc., nor its employees, service providers, associates, or affiliates are responsible for any investment losses you may incur as a result of using the information provided herein. Remember that past investment returns may not be indicative of future returns.

Copyright © 1998-2017 ETFOptimize.com, a publication of Optimized Investments, Inc. All rights reserved.