
WaFd Bank trades at $32.18 and has moved in lockstep with the market. Its shares have returned 13.3% over the last six months while the S&P 500 has gained 15.4%.
Is now the time to buy WaFd Bank, or should you be careful about including it in your portfolio? Get the full breakdown from our expert analysts, it’s free for active Edge members.
Why Do We Think WaFd Bank Will Underperform?
We're cautious about WaFd Bank. Here are three reasons we avoid WAFD and a stock we'd rather own.
1. Net Interest Income Points to Soft Demand
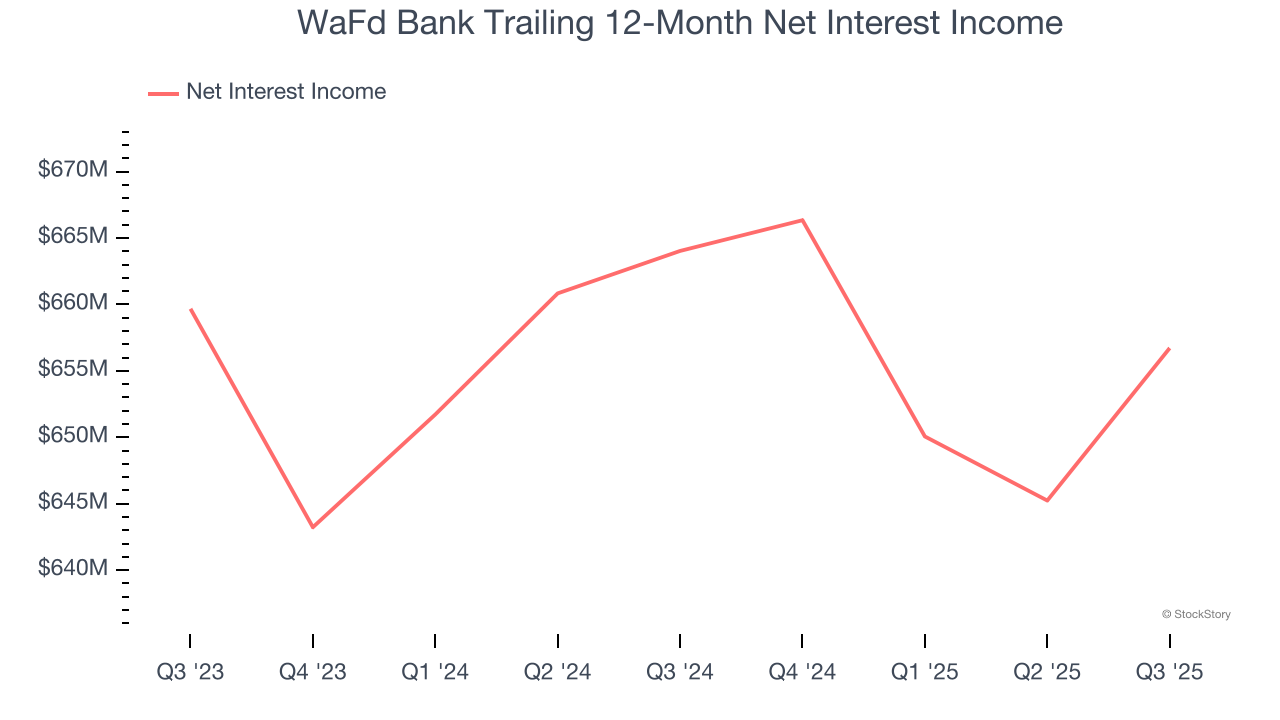
Net interest income commands greater market attention due to its reliability and consistency, whereas one-time fees are often seen as lower-quality revenue that lacks the same dependable characteristics.
WaFd Bank’s net interest income has grown at a 6.9% annualized rate over the last five years, worse than the broader banking industry and in line with its total revenue.
2. Net Interest Margin Dropping
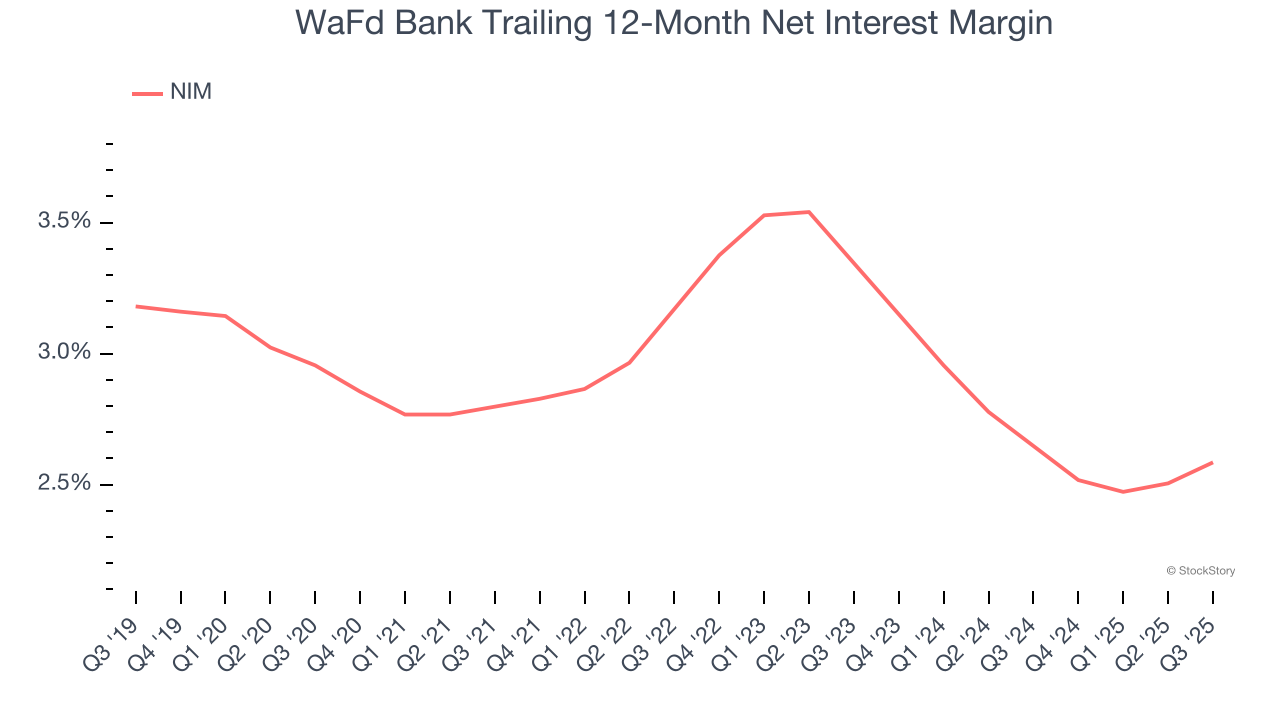
Net interest margin (NIM) represents how much a bank earns in relation to its outstanding loans. It's one of the most important metrics to track because it shows how a bank's loans are performing and whether it has the ability to command higher premiums for its services.
Over the past two years, WaFd Bank’s net interest margin averaged 2.6%. Its margin also contracted by 76 basis points (100 basis points = 1 percentage point) over that period.
This decline was a headwind for its net interest income. While prevailing rates are a major determinant of net interest margin changes over time, the decline could mean that WaFd Bank either faced competition for loans and deposits or experienced a negative mix shift in its balance sheet composition.
3. EPS Barely Growing
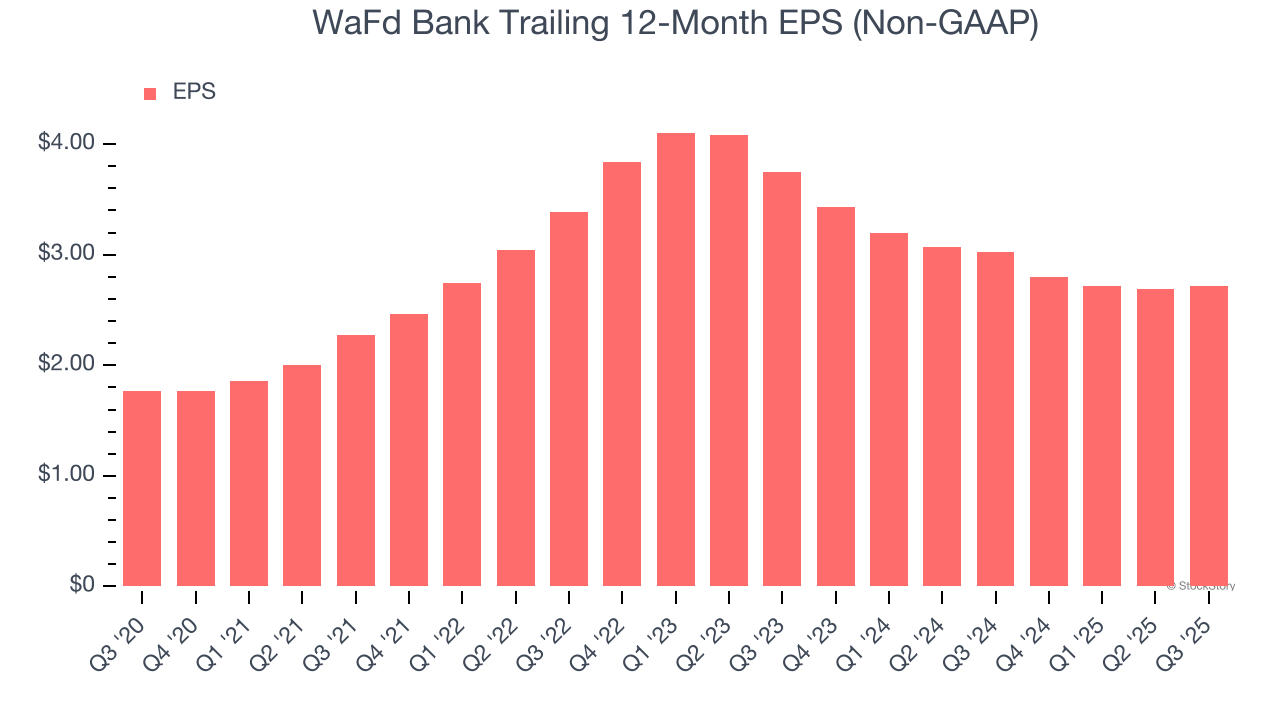
Analyzing the long-term change in earnings per share (EPS) shows whether a company's incremental sales were profitable – for example, revenue could be inflated through excessive spending on advertising and promotions.
WaFd Bank’s EPS grew at an unimpressive 9% compounded annual growth rate over the last five years. On the bright side, this performance was better than its 6.7% annualized revenue growth and tells us the company became more profitable on a per-share basis as it expanded.
Final Judgment
We cheer for all companies supporting the economy, but in the case of WaFd Bank, we’ll be cheering from the sidelines. That said, the stock currently trades at 0.9× forward P/B (or $32.18 per share). This valuation tells us a lot of optimism is priced in - you can find more timely opportunities elsewhere. We’d suggest looking at a fast-growing restaurant franchise with an A+ ranch dressing sauce.
High-Quality Stocks for All Market Conditions
Your portfolio can’t afford to be based on yesterday’s story. The risk in a handful of heavily crowded stocks is rising daily.
The names generating the next wave of massive growth are right here in our Top 6 Stocks for this week. This is a curated list of our High Quality stocks that have generated a market-beating return of 244% over the last five years (as of June 30, 2025).
Stocks that have made our list include now familiar names such as Nvidia (+1,326% between June 2020 and June 2025) as well as under-the-radar businesses like the once-micro-cap company Kadant (+351% five-year return). Find your next big winner with StockStory today.
StockStory is growing and hiring equity analyst and marketing roles. Are you a 0 to 1 builder passionate about the markets and AI? See the open roles here.