
NetApp trades at $117.27 and has moved in lockstep with the market. Its shares have returned 13.8% over the last six months while the S&P 500 has gained 14.1%.
Is NTAP a buy right now? Find out in our full research report, it’s free for active Edge members.
Why Does NetApp Spark Debate?
Founded in 1992 as a pioneer in networked storage technology, NetApp (NASDAQ: NTAP) provides data storage and management solutions that help organizations store, protect, and optimize their data across on-premises data centers and public clouds.
Two Positive Attributes:
1. Billings Growth Boosts Cash On Hand
Billings is a non-GAAP metric that sheds light on NetApp’s demand characteristics. This metric is often called “cash revenue” because it shows how much money the company has collected from customers in a certain period - different from reported revenue, which must be recognized in pieces over the length of a contract.
NetApp’s billings punched in at $1.65 billion in the latest quarter, and over the last two years, its year-on-year growth averaged 7.2%. This performance was solid, indicating robust customer demand. The cash collected from customers also enhances liquidity and provides a solid foundation for future investments and growth. 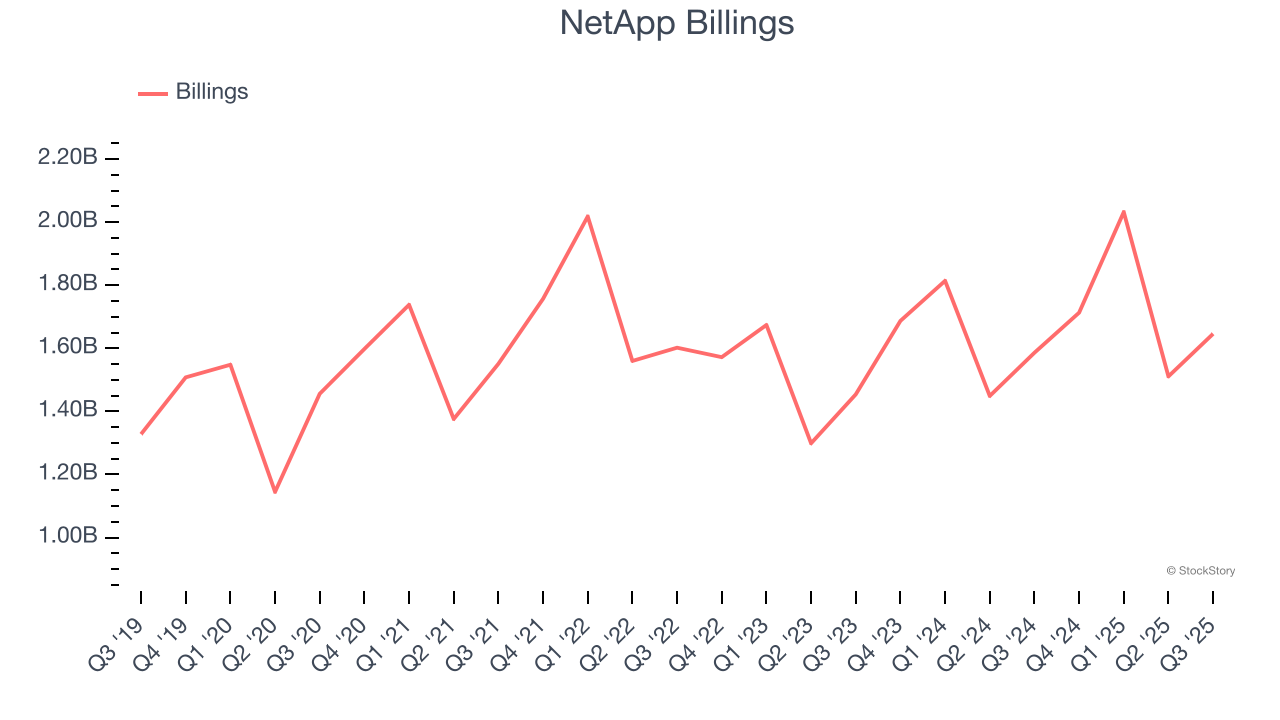
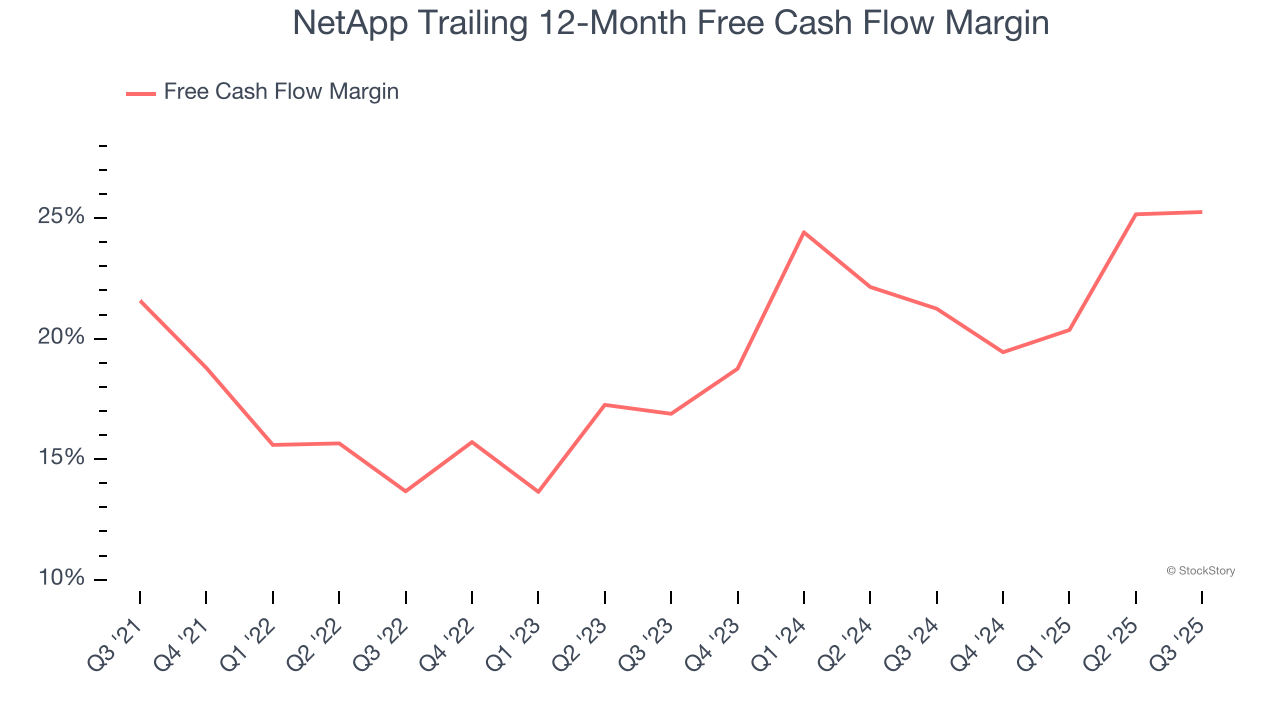
2. Excellent Free Cash Flow Margin Boosts Reinvestment Potential
Free cash flow isn't a prominently featured metric in company financials and earnings releases, but we think it's telling because it accounts for all operating and capital expenses, making it tough to manipulate. Cash is king.
NetApp has shown terrific cash profitability, enabling it to reinvest, return capital to investors, and stay ahead of the competition while maintaining an ample cushion. The company’s free cash flow margin was among the best in the business services sector, averaging 19.7% over the last five years.
One Reason to be Careful:
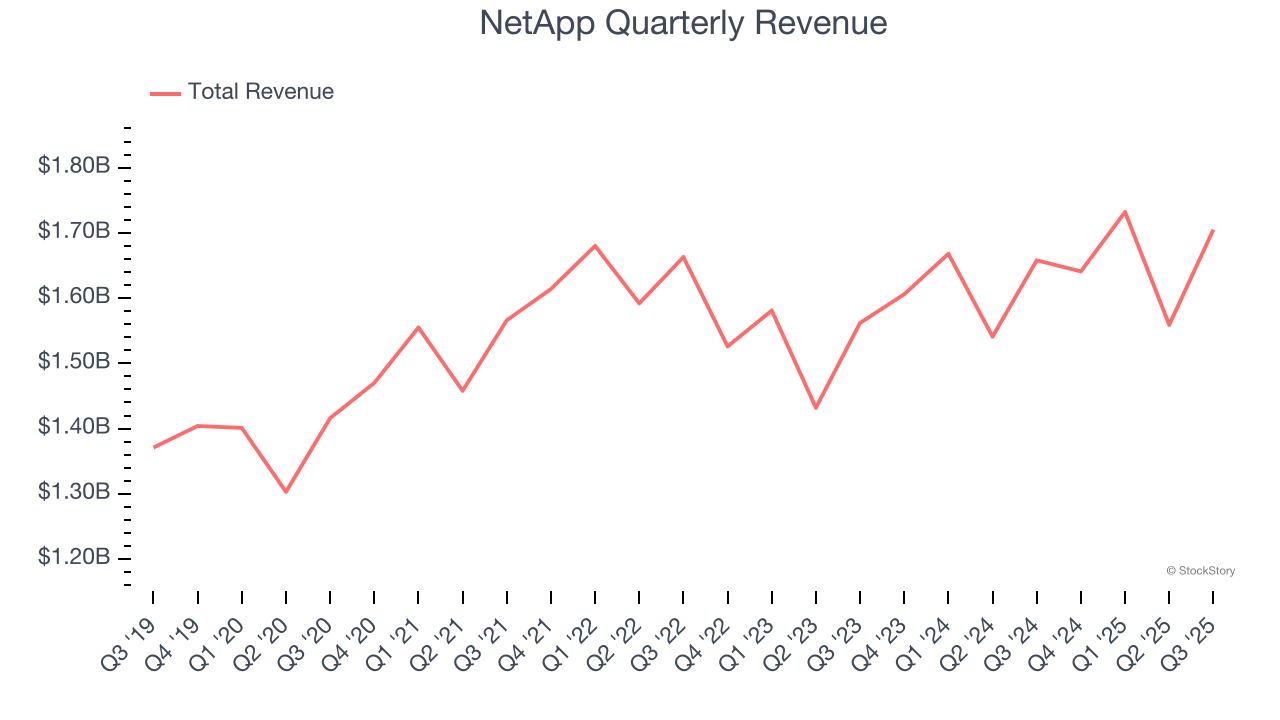
Long-Term Revenue Growth Disappoints
Reviewing a company’s long-term sales performance reveals insights into its quality. Even a bad business can shine for one or two quarters, but a top-tier one grows for years. Regrettably, NetApp’s sales grew at a tepid 3.7% compounded annual growth rate over the last five years. This wasn’t a great result compared to the rest of the business services sector, but there are still things to like about NetApp.
Final Judgment
NetApp’s positive characteristics outweigh the negatives, but at $117.27 per share (or 13.9× forward P/E), is now the right time to buy the stock? See for yourself in our full research report, it’s free for active Edge members.
High-Quality Stocks for All Market Conditions
If your portfolio success hinges on just 4 stocks, your wealth is built on fragile ground. You have a small window to secure high-quality assets before the market widens and these prices disappear.
Don’t wait for the next volatility shock. Check out our Top 6 Stocks for this week. This is a curated list of our High Quality stocks that have generated a market-beating return of 244% over the last five years (as of June 30, 2025).
Stocks that have made our list include now familiar names such as Nvidia (+1,326% between June 2020 and June 2025) as well as under-the-radar businesses like the once-micro-cap company Kadant (+351% five-year return). Find your next big winner with StockStory today.
StockStory is growing and hiring equity analyst and marketing roles. Are you a 0 to 1 builder passionate about the markets and AI? See the open roles here.