
Over the last six months, Ameriprise Financial’s shares have sunk to $477.07, producing a disappointing 7.9% loss - a stark contrast to the S&P 500’s 14.1% gain. This may have investors wondering how to approach the situation.
Given the weaker price action, is now the time to buy AMP? Find out in our full research report, it’s free for active Edge members.
Why Are We Positive On AMP?
Founded in 1894 and spun off from American Express in 2005, Ameriprise Financial (NYSE: AMP) provides financial planning, wealth management, asset management, and insurance products to help individuals and institutions achieve their financial goals.
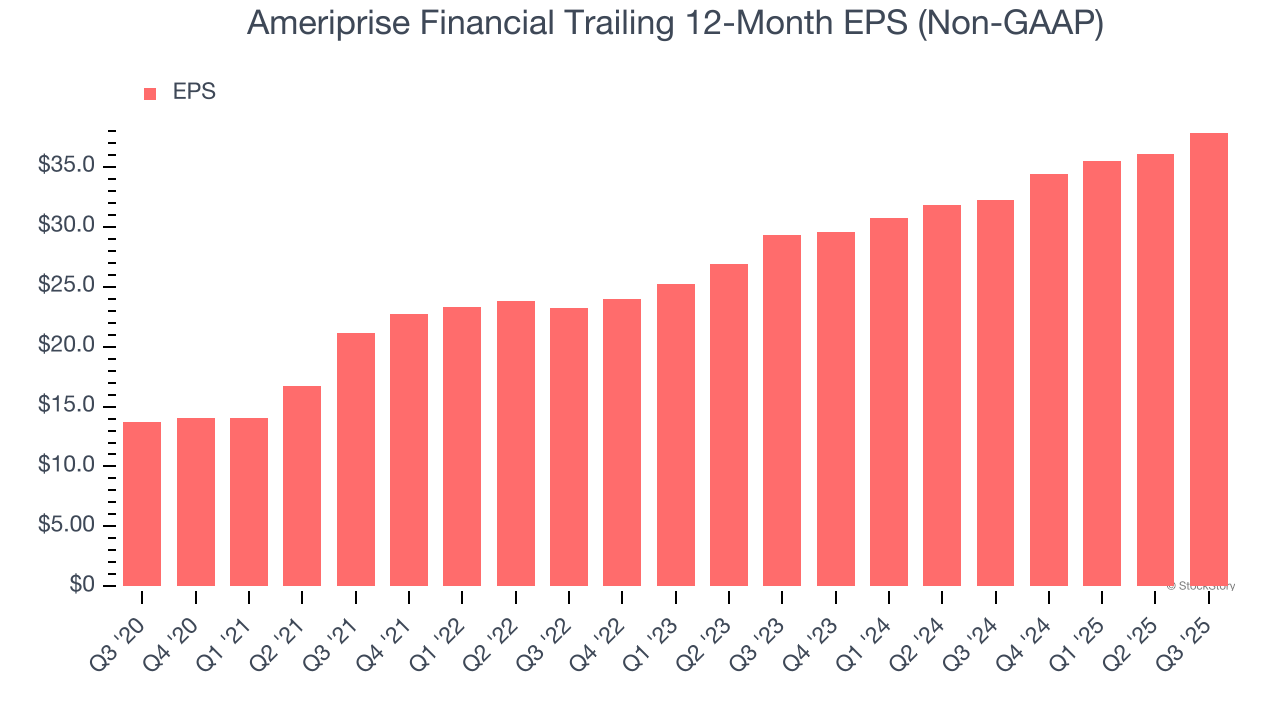
1. Outstanding Long-Term EPS Growth
Analyzing the long-term change in earnings per share (EPS) shows whether a company's incremental sales were profitable – for example, revenue could be inflated through excessive spending on advertising and promotions.
Ameriprise Financial’s EPS grew at a spectacular 22.5% compounded annual growth rate over the last five years, higher than its 8.7% annualized revenue growth. This tells us the company became more profitable on a per-share basis as it expanded.
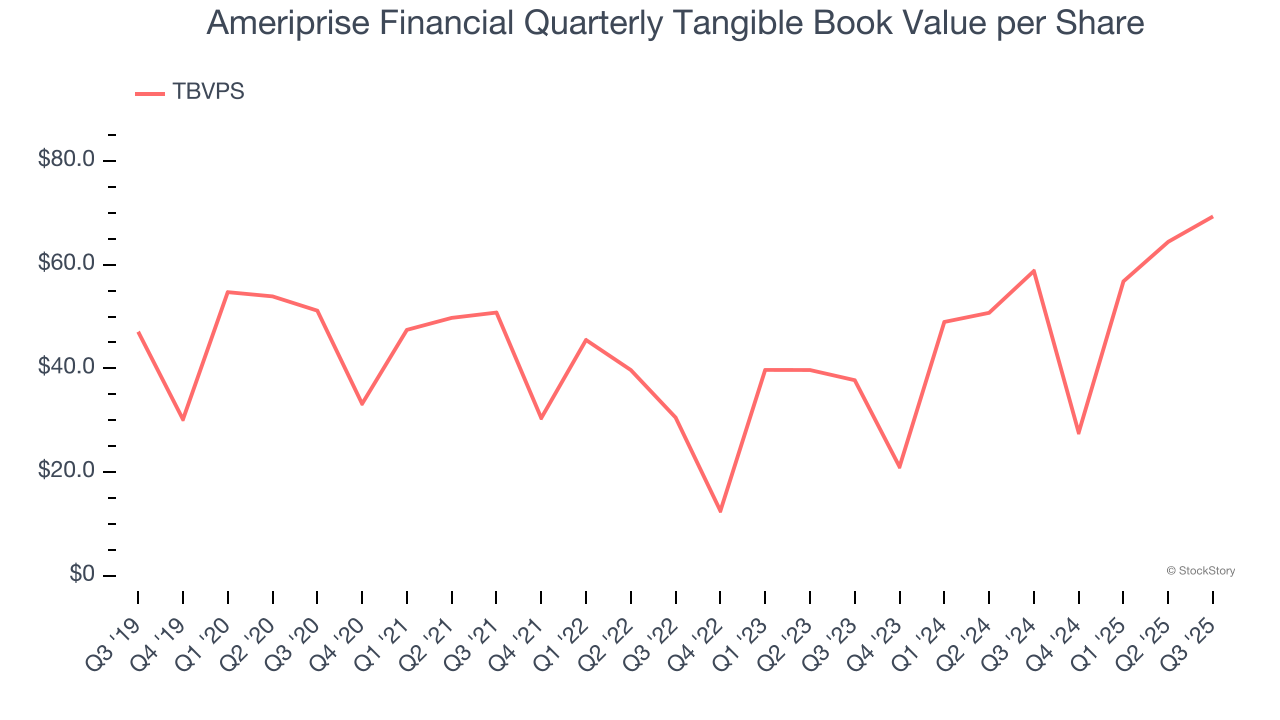
2. Growing TBVPS Reflects Strong Asset Base
In the financials industry, tangible book value per share (TBVPS) provides the clearest picture of shareholder value, as it focuses on concrete assets while excluding intangible items that may not hold value during challenging times.
Although Ameriprise Financial’s TBVPS increased by a meager 6.3% annually over the last five years, the good news is that its growth has recently accelerated as TBVPS grew at an incredible 35.5% annual clip over the past two years (from $37.73 to $69.31 per share).
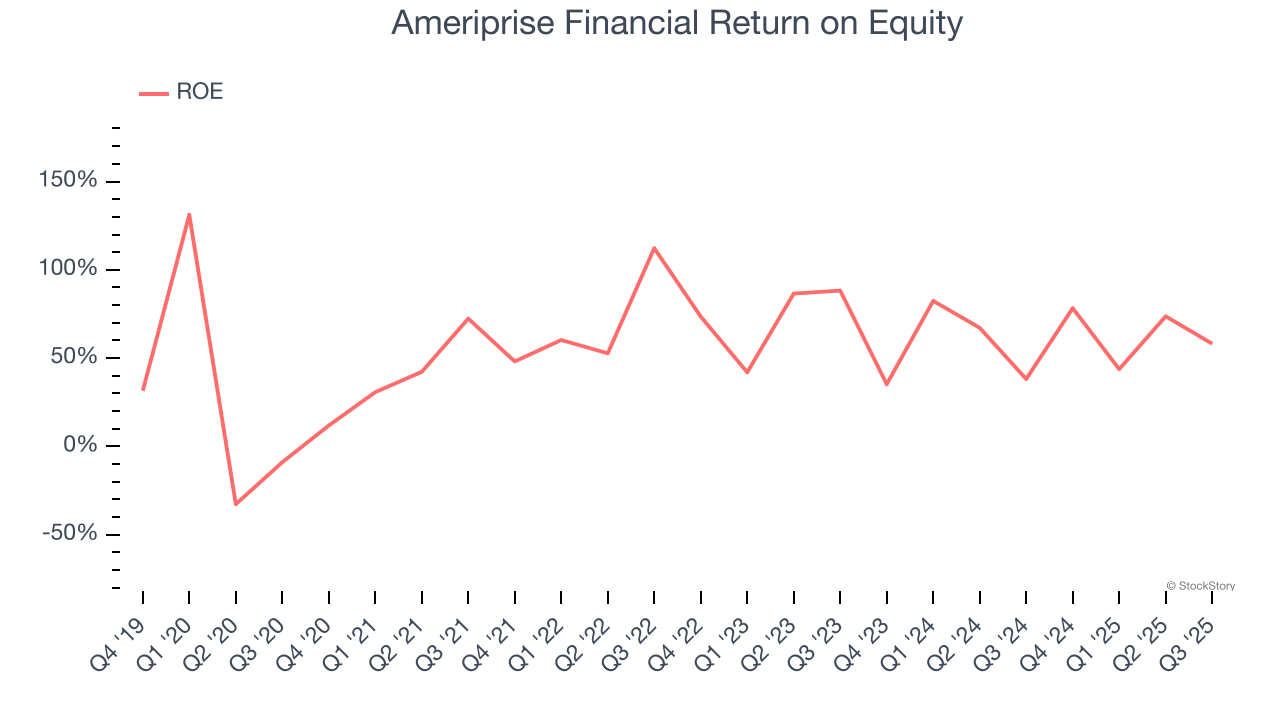
3. Stellar ROE Showcases Lucrative Growth Opportunities
Return on equity, or ROE, quantifies bank profitability relative to shareholder equity - an essential capital source for these institutions. Over extended periods, superior ROE performance drives faster shareholder wealth compounding through reinvestment, share repurchases, and dividend growth.
Over the last five years, Ameriprise Financial has averaged an ROE of 59.9%, exceptional for a company operating in a sector where the average shakes out around 10% and those putting up 25%+ are greatly admired. This shows Ameriprise Financial has a strong competitive moat.
Final Judgment
These are just a few reasons why we think Ameriprise Financial is a great business. With the recent decline, the stock trades at 11.5× forward P/E (or $477.07 per share). Is now the time to initiate a position? See for yourself in our comprehensive research report, it’s free for active Edge members .
High-Quality Stocks for All Market Conditions
Your portfolio can’t afford to be based on yesterday’s story. The risk in a handful of heavily crowded stocks is rising daily.
The names generating the next wave of massive growth are right here in our Top 5 Growth Stocks for this month. This is a curated list of our High Quality stocks that have generated a market-beating return of 244% over the last five years (as of June 30, 2025).
Stocks that have made our list include now familiar names such as Nvidia (+1,326% between June 2020 and June 2025) as well as under-the-radar businesses like the once-micro-cap company Tecnoglass (+1,754% five-year return). Find your next big winner with StockStory today.
StockStory is growing and hiring equity analyst and marketing roles. Are you a 0 to 1 builder passionate about the markets and AI? See the open roles here.


