BD trades at $194.13 per share and has stayed right on track with the overall market, gaining 12.5% over the last six months. At the same time, the S&P 500 has returned 14.1%.
Is there a buying opportunity in BD, or does it present a risk to your portfolio? Get the full stock story straight from our expert analysts, it’s free for active Edge members.
Why Is BD Not Exciting?
We're sitting this one out for now. Here are three reasons why BDX doesn't excite us and a stock we'd rather own.
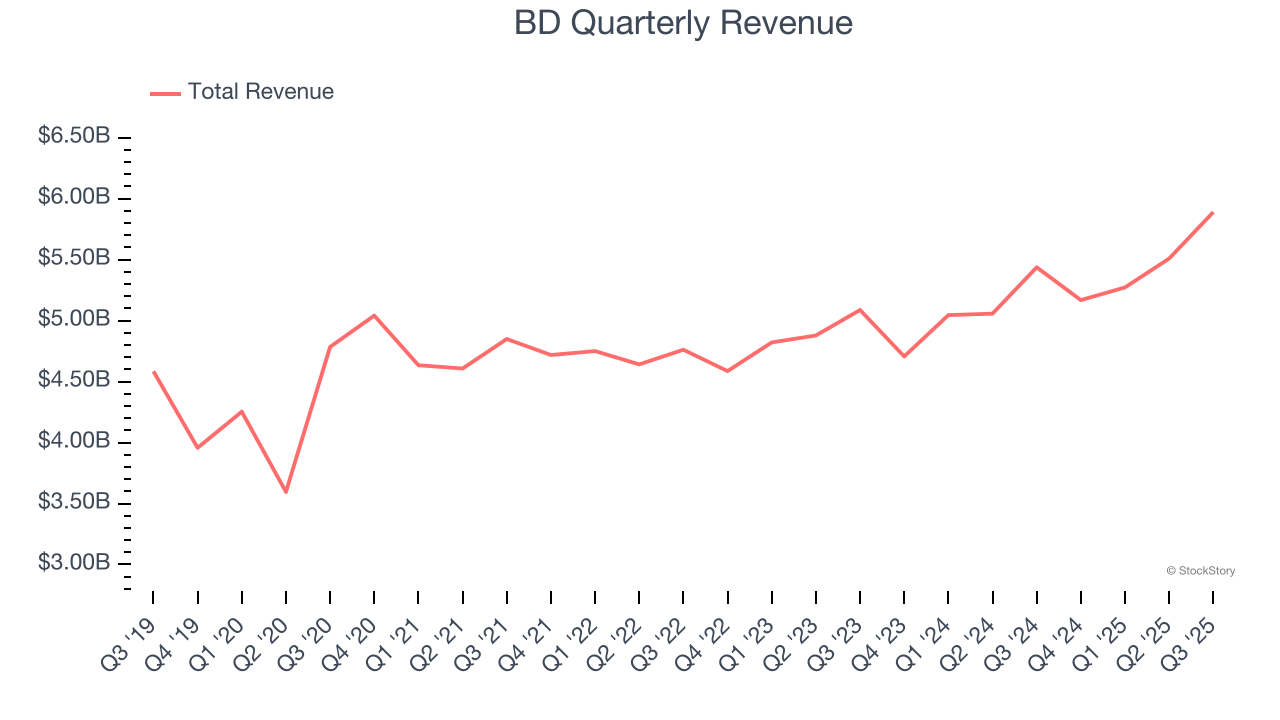
1. Long-Term Revenue Growth Disappoints
A company’s long-term performance is an indicator of its overall quality. Any business can experience short-term success, but top-performing ones enjoy sustained growth for years. Unfortunately, BD’s 5.7% annualized revenue growth over the last five years was mediocre. This was below our standard for the healthcare sector.
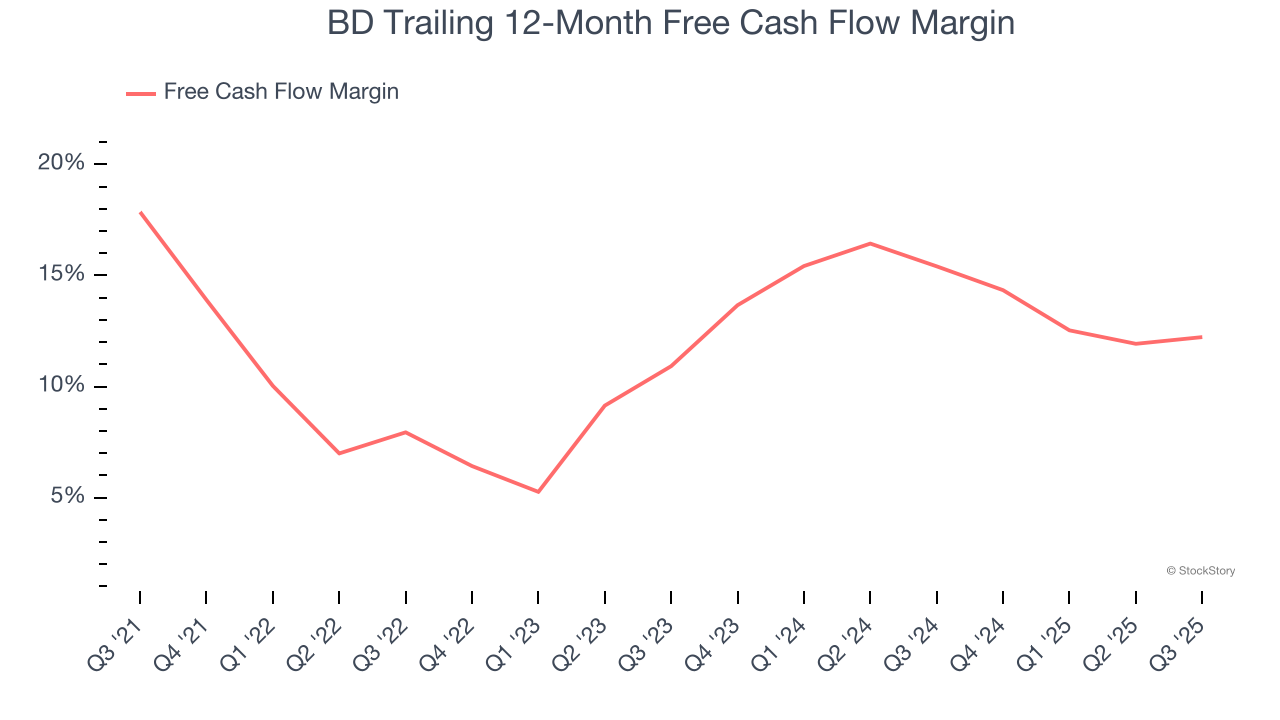
2. Free Cash Flow Margin Dropping
Free cash flow isn't a prominently featured metric in company financials and earnings releases, but we think it's telling because it accounts for all operating and capital expenses, making it tough to manipulate. Cash is king.
As you can see below, BD’s margin dropped by 5.6 percentage points over the last five years. If its declines continue, it could signal increasing investment needs and capital intensity. BD’s free cash flow margin for the trailing 12 months was 12.2%.
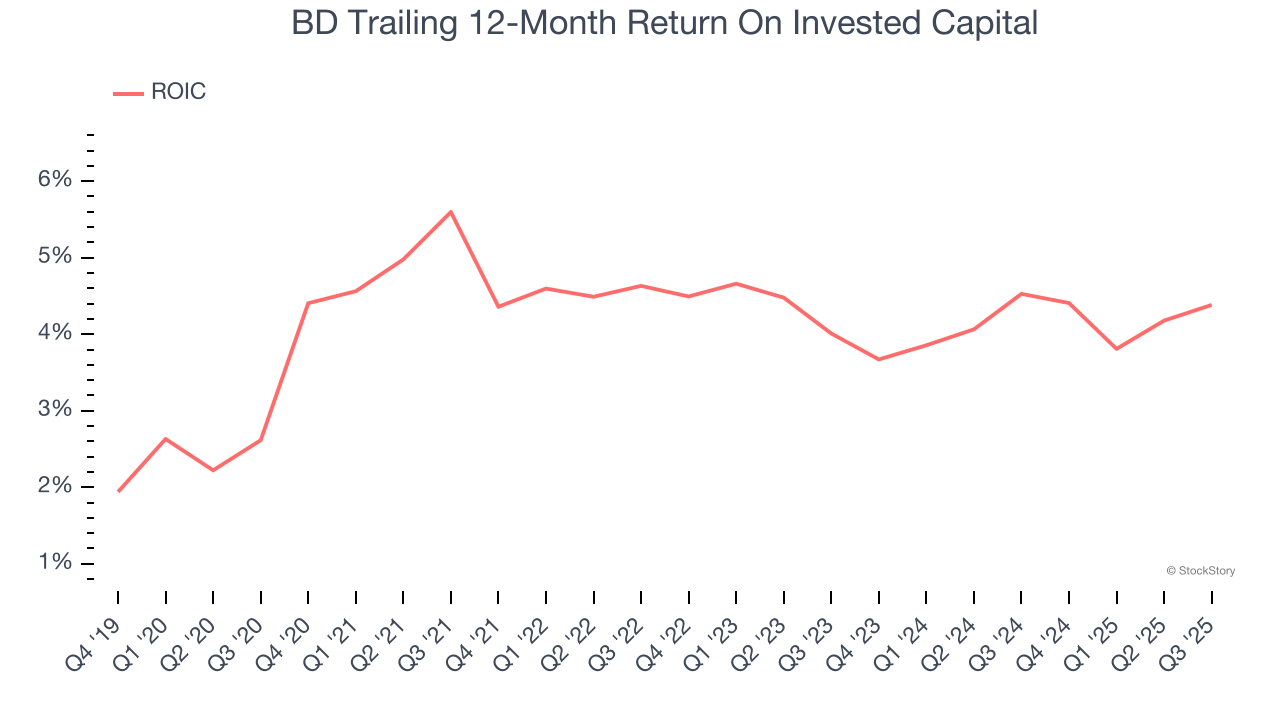
3. Previous Growth Initiatives Haven’t Impressed
Growth gives us insight into a company’s long-term potential, but how capital-efficient was that growth? Enter ROIC, a metric showing how much operating profit a company generates relative to the money it has raised (debt and equity).
BD historically did a mediocre job investing in profitable growth initiatives. Its five-year average ROIC was 4.6%, lower than the typical cost of capital (how much it costs to raise money) for healthcare companies.
Final Judgment
BD’s business quality ultimately falls short of our standards. That said, the stock currently trades at 13× forward P/E (or $194.13 per share). While this valuation is fair, the upside isn’t great compared to the potential downside. We're fairly confident there are better investments elsewhere. Let us point you toward the most entrenched endpoint security platform on the market.
Stocks We Would Buy Instead of BD
Your portfolio can’t afford to be based on yesterday’s story. The risk in a handful of heavily crowded stocks is rising daily.
The names generating the next wave of massive growth are right here in our Top 5 Growth Stocks for this month. This is a curated list of our High Quality stocks that have generated a market-beating return of 244% over the last five years (as of June 30, 2025).
Stocks that have made our list include now familiar names such as Nvidia (+1,326% between June 2020 and June 2025) as well as under-the-radar businesses like the once-small-cap company Comfort Systems (+782% five-year return). Find your next big winner with StockStory today.
StockStory is growing and hiring equity analyst and marketing roles. Are you a 0 to 1 builder passionate about the markets and AI? See the open roles here.


