
Graham Corporation currently trades at $57.94 and has been a dream stock for shareholders. It’s returned 260% since December 2020, more than tripling the S&P 500’s 84.9% gain. The company has also beaten the index over the past six months as its stock price is up 29.7% thanks to its solid quarterly results.
Is there a buying opportunity in Graham Corporation, or does it present a risk to your portfolio? Get the full breakdown from our expert analysts, it’s free for active Edge members.
Why Is Graham Corporation Not Exciting?
We’re happy investors have made money, but we're swiping left on Graham Corporation for now. Here are three reasons why GHM doesn't excite us and a stock we'd rather own.
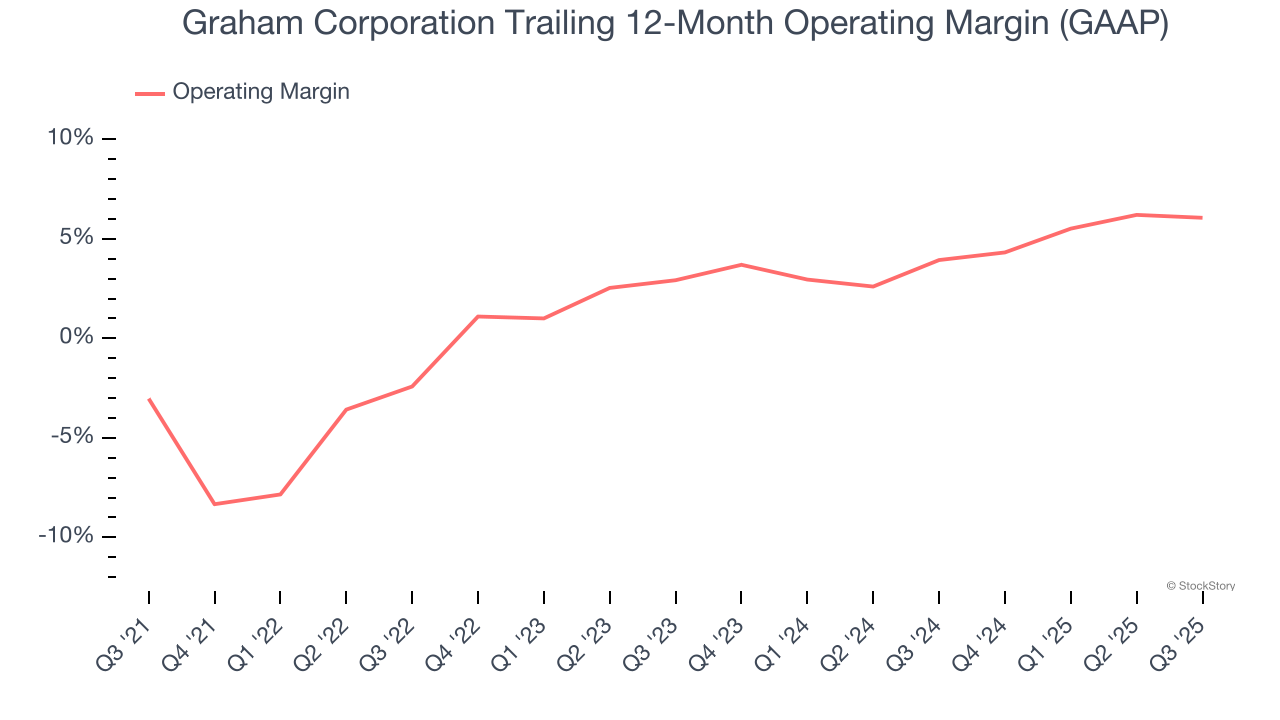
1. Weak Operating Margin Could Cause Trouble
Operating margin is an important measure of profitability as it shows the portion of revenue left after accounting for all core expenses – everything from the cost of goods sold to advertising and wages. It’s also useful for comparing profitability across companies with different levels of debt and tax rates because it excludes interest and taxes.
Graham Corporation was profitable over the last five years but held back by its large cost base. Its average operating margin of 2.3% was weak for an industrials business. This result isn’t too surprising given its low gross margin as a starting point.
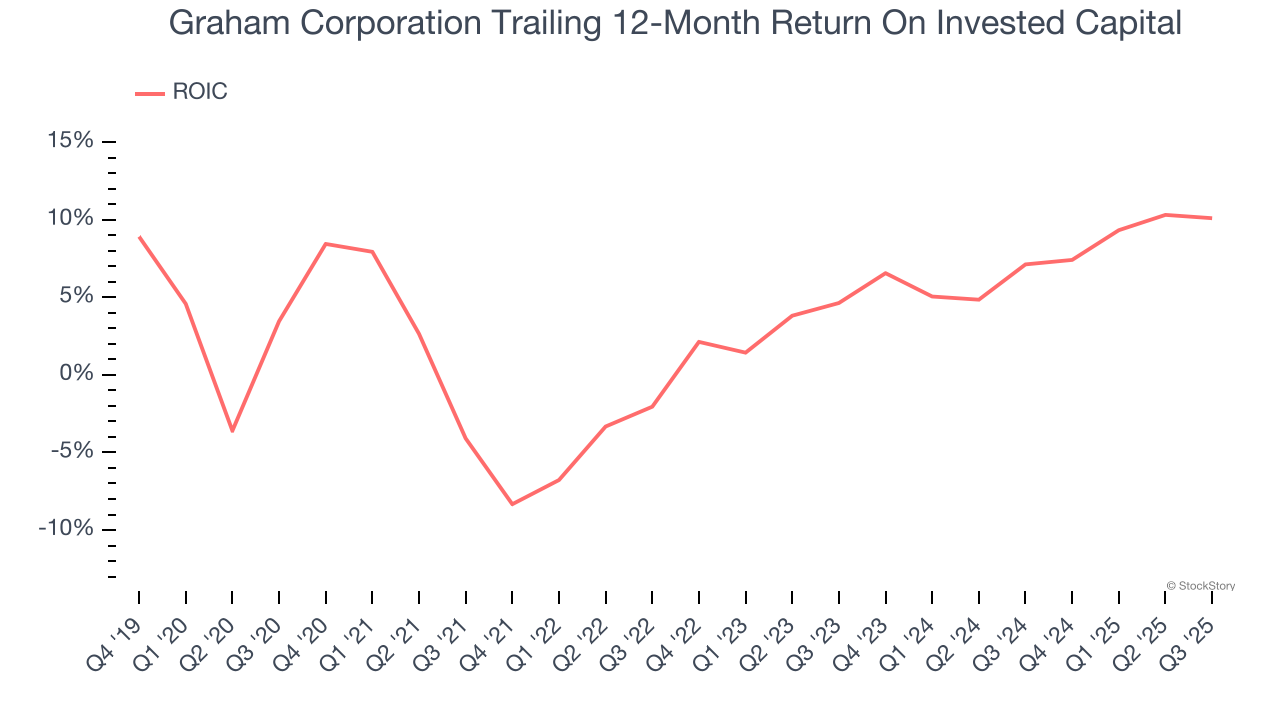
2. Previous Growth Initiatives Haven’t Impressed
Growth gives us insight into a company’s long-term potential, but how capital-efficient was that growth? A company’s ROIC explains this by showing how much operating profit it makes compared to the money it has raised (debt and equity).
Graham Corporation historically did a mediocre job investing in profitable growth initiatives. Its five-year average ROIC was 3.1%, lower than the typical cost of capital (how much it costs to raise money) for industrials companies.
3. Short Cash Runway Exposes Shareholders to Potential Dilution
As long-term investors, the risk we care about most is the permanent loss of capital, which can happen when a company goes bankrupt or raises money from a disadvantaged position. This is separate from short-term stock price volatility, something we are much less bothered by.
Graham Corporation burned through $10.65 million of cash over the last year. With $20.58 million of cash on its balance sheet, the company has around 23 months of runway left (assuming its $6.35 million of debt isn’t due right away).
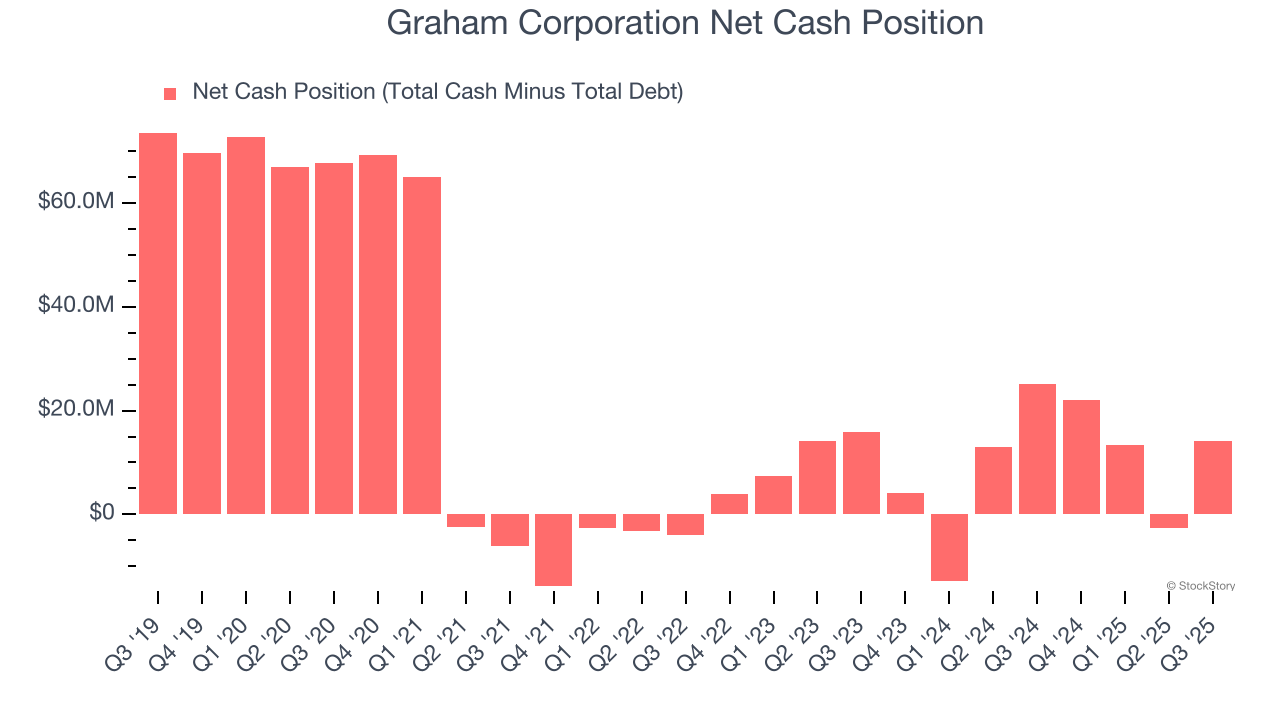
Unless the Graham Corporation’s fundamentals change quickly, it might find itself in a position where it must raise capital from investors to continue operating. Whether that would be favorable is unclear because dilution is a headwind for shareholder returns.
We remain cautious of Graham Corporation until it generates consistent free cash flow or any of its announced financing plans materialize on its balance sheet.
Final Judgment
Graham Corporation’s business quality ultimately falls short of our standards. With its shares beating the market recently, the stock trades at 40.1× forward P/E (or $57.94 per share). Investors with a higher risk tolerance might like the company, but we don’t really see a big opportunity at the moment. We're pretty confident there are more exciting stocks to buy at the moment. We’d suggest looking at one of our top digital advertising picks.
Stocks We Like More Than Graham Corporation
The market’s up big this year - but there’s a catch. Just 4 stocks account for half the S&P 500’s entire gain. That kind of concentration makes investors nervous, and for good reason. While everyone piles into the same crowded names, smart investors are hunting quality where no one’s looking - and paying a fraction of the price. Check out the high-quality names we’ve flagged in our Top 5 Strong Momentum Stocks for this week. This is a curated list of our High Quality stocks that have generated a market-beating return of 244% over the last five years (as of June 30, 2025).
Stocks that have made our list include now familiar names such as Nvidia (+1,326% between June 2020 and June 2025) as well as under-the-radar businesses like the once-micro-cap company Kadant (+351% five-year return). Find your next big winner with StockStory today.
StockStory is growing and hiring equity analyst and marketing roles. Are you a 0 to 1 builder passionate about the markets and AI? See the open roles here.


