Burlington has followed the market’s trajectory closely, rising in tandem with the S&P 500 over the past six months. The stock has climbed by 10.1% to $271.92 per share while the index has gained 14.1%.
Is there a buying opportunity in Burlington, or does it present a risk to your portfolio? See what our analysts have to say in our full research report, it’s free for active Edge members.
Why Is Burlington Not Exciting?
We're swiping left on Burlington for now. Here are three reasons why BURL doesn't excite us and a stock we'd rather own.
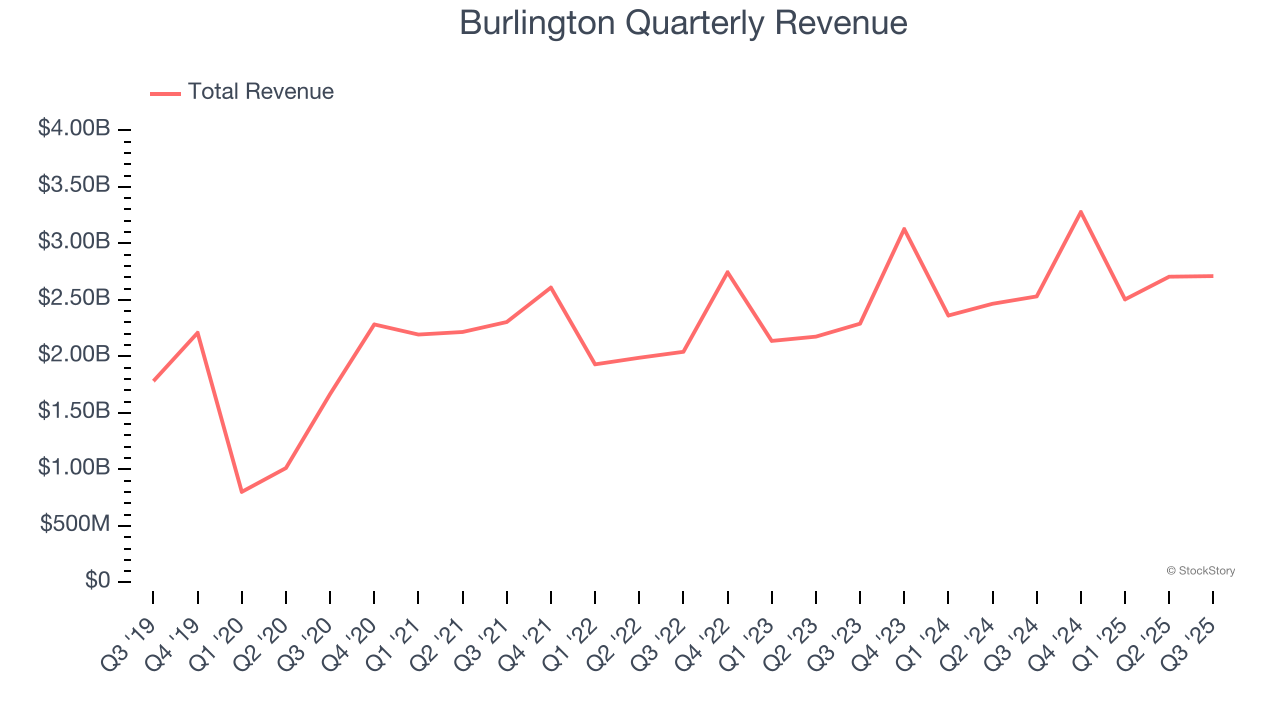
1. Long-Term Revenue Growth Disappoints
Reviewing a company’s long-term sales performance reveals insights into its quality. Any business can experience short-term success, but top-performing ones enjoy sustained growth for years. Regrettably, Burlington’s sales grew at a mediocre 9.3% compounded annual growth rate over the last three years. This fell short of our benchmark for the consumer retail sector.
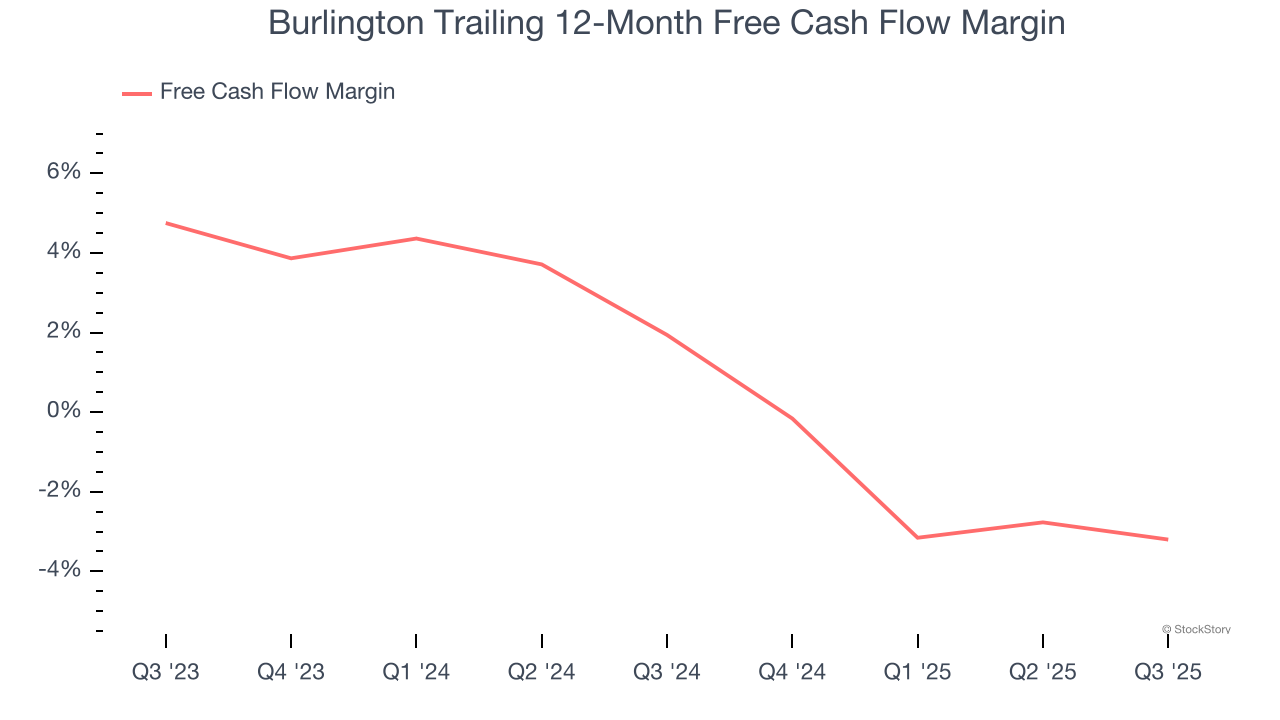
2. Free Cash Flow Margin Dropping
Free cash flow isn't a prominently featured metric in company financials and earnings releases, but we think it's telling because it accounts for all operating and capital expenses, making it tough to manipulate. Cash is king.
As you can see below, Burlington’s margin dropped by 5.1 percentage points over the last year. This decrease came from the higher costs associated with opening more stores.
3. Previous Growth Initiatives Haven’t Impressed
Growth gives us insight into a company’s long-term potential, but how capital-efficient was that growth? A company’s ROIC explains this by showing how much operating profit it makes compared to the money it has raised (debt and equity).
Burlington historically did a mediocre job investing in profitable growth initiatives. Its five-year average ROIC was 9%, somewhat low compared to the best consumer retail companies that consistently pump out 25%+.
Final Judgment
Burlington isn’t a terrible business, but it isn’t one of our picks. That said, the stock currently trades at 24.7× forward P/E (or $271.92 per share). While this valuation is reasonable, we don’t really see a big opportunity at the moment. We're fairly confident there are better investments elsewhere. Let us point you toward one of our top software and edge computing picks.
Stocks We Would Buy Instead of Burlington
Your portfolio can’t afford to be based on yesterday’s story. The risk in a handful of heavily crowded stocks is rising daily.
The names generating the next wave of massive growth are right here in our Top 5 Strong Momentum Stocks for this week. This is a curated list of our High Quality stocks that have generated a market-beating return of 244% over the last five years (as of June 30, 2025).
Stocks that have made our list include now familiar names such as Nvidia (+1,326% between June 2020 and June 2025) as well as under-the-radar businesses like the once-micro-cap company Kadant (+351% five-year return). Find your next big winner with StockStory today.
StockStory is growing and hiring equity analyst and marketing roles. Are you a 0 to 1 builder passionate about the markets and AI? See the open roles here.