Over the last six months, Dutch Bros’s shares have sunk to $58.78, producing a disappointing 19.9% loss - a stark contrast to the S&P 500’s 14.1% gain. This may have investors wondering how to approach the situation.
Following the pullback, is now an opportune time to buy BROS? Find out in our full research report, it’s free for active Edge members.
Why Are We Positive On Dutch Bros?
Started in 1992 by two brothers as a single pushcart, Dutch Bros (NYSE: BROS) is a dynamic coffee chain that’s captured the hearts of coffee enthusiasts across the United States.
1. New Restaurants Opening at Breakneck Speed
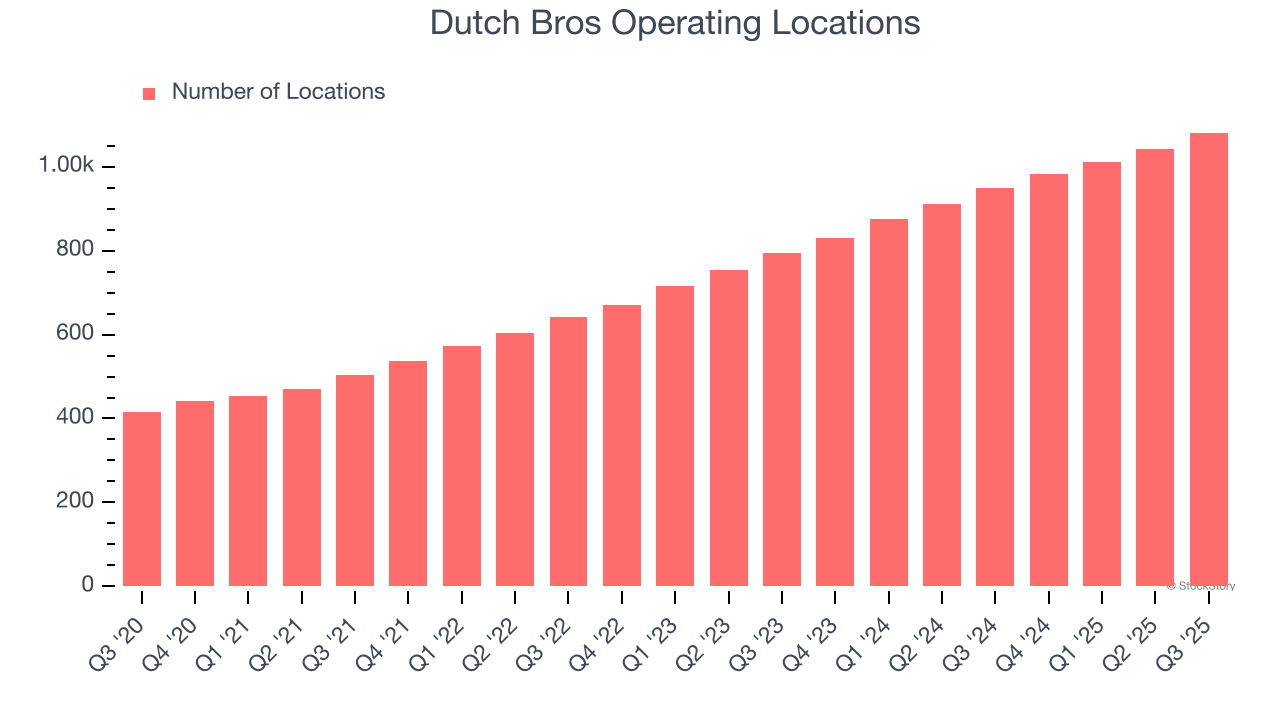
A restaurant chain’s total number of dining locations often determines how much revenue it can generate.
Dutch Bros operated 1,081 locations in the latest quarter. It has opened new restaurants at a rapid clip over the last two years, averaging 18.6% annual growth, much faster than the broader restaurant sector. This gives it a chance to become a large, scaled business over time.
When a chain opens new restaurants, it usually means it’s investing for growth because there’s healthy demand for its meals and there are markets where its concepts have few or no locations.
2. Surging Same-Store Sales Show Increasing Demand
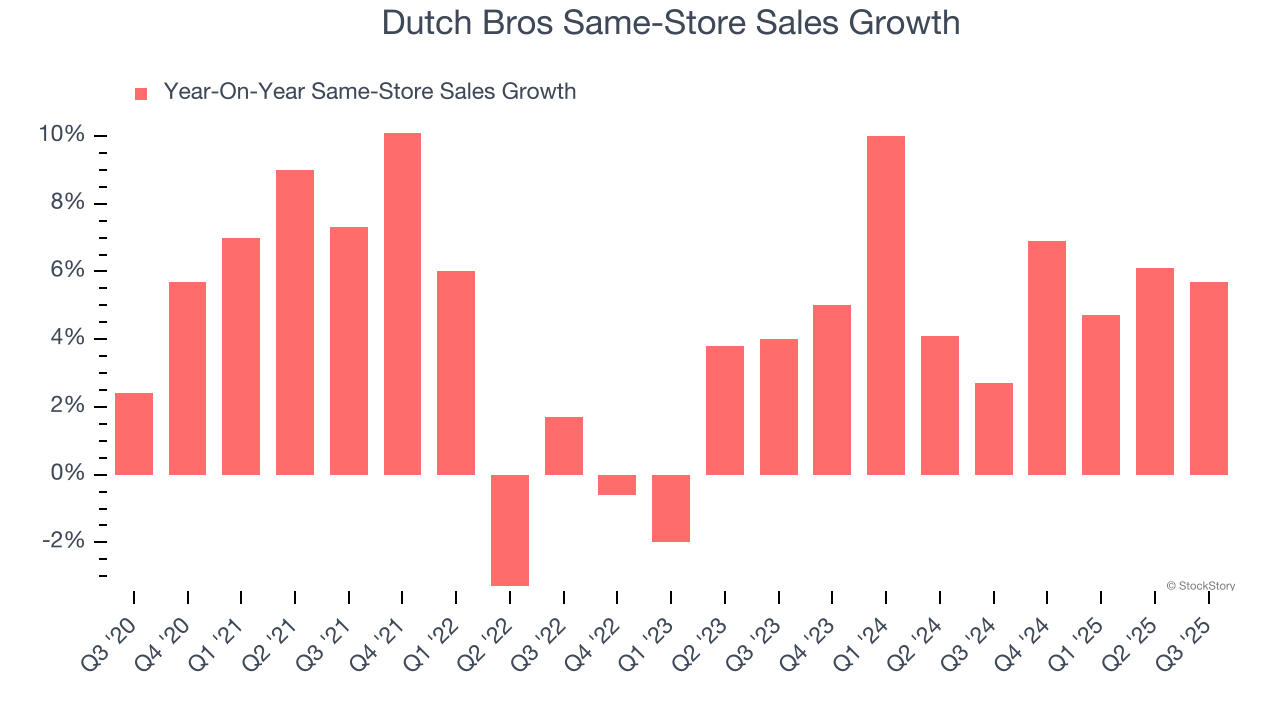
Same-store sales show the change in sales at restaurants open for at least a year. This is a key performance indicator because it measures organic growth.
Dutch Bros has been one of the most successful restaurant chains over the last two years thanks to skyrocketing demand within its existing dining locations. On average, the company has posted exceptional year-on-year same-store sales growth of 5.7%.
3. Increasing Free Cash Flow Margin Juices Financials
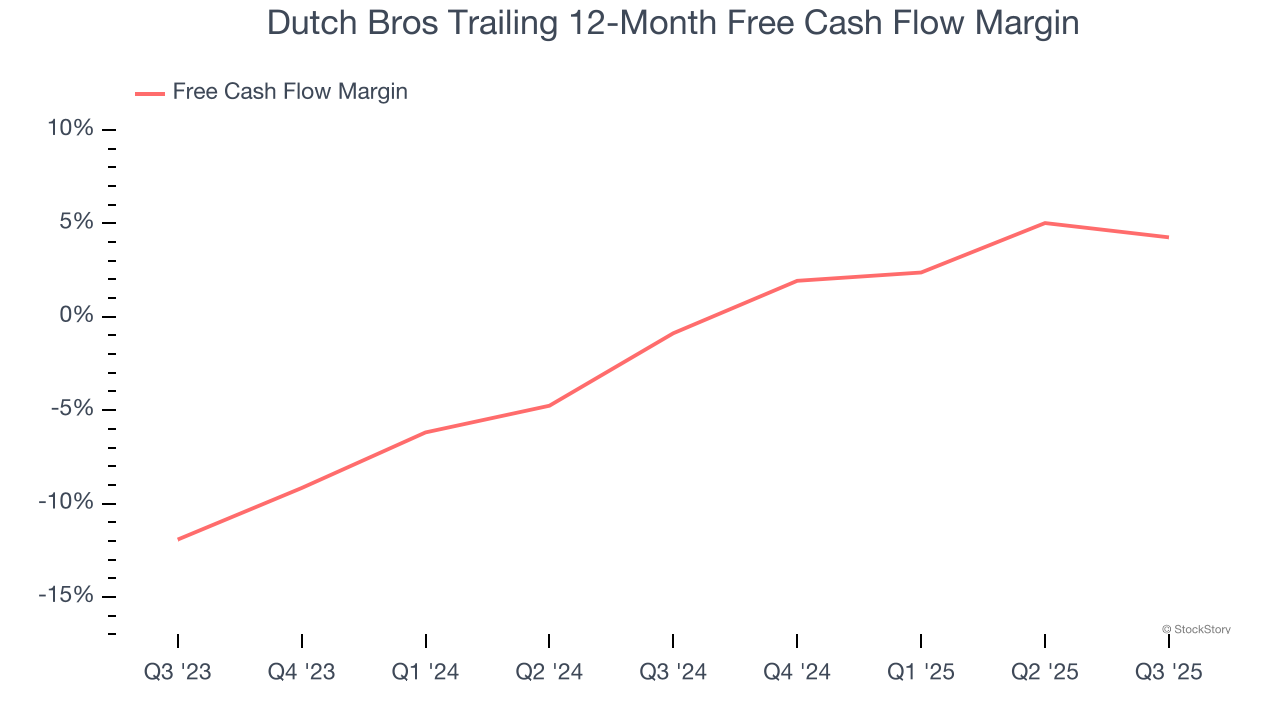
Free cash flow isn't a prominently featured metric in company financials and earnings releases, but we think it's telling because it accounts for all operating and capital expenses, making it tough to manipulate. Cash is king.
As you can see below, Dutch Bros’s margin expanded by 5.1 percentage points over the last year. The company’s improvement shows it’s heading in the right direction, and we can see it became a less capital-intensive business because its free cash flow profitability rose more than its operating profitability. Dutch Bros’s free cash flow margin for the trailing 12 months was 4.3%.
Final Judgment
These are just a few reasons why we're bullish on Dutch Bros. With the recent decline, the stock trades at 72.9× forward P/E (or $58.78 per share). Is now the right time to buy? See for yourself in our full research report, it’s free for active Edge members.
High-Quality Stocks for All Market Conditions
If your portfolio success hinges on just 4 stocks, your wealth is built on fragile ground. You have a small window to secure high-quality assets before the market widens and these prices disappear.
Don’t wait for the next volatility shock. Check out our Top 6 Stocks for this week. This is a curated list of our High Quality stocks that have generated a market-beating return of 244% over the last five years (as of June 30, 2025).
Stocks that have made our list include now familiar names such as Nvidia (+1,326% between June 2020 and June 2025) as well as under-the-radar businesses like the once-small-cap company Comfort Systems (+782% five-year return). Find your next big winner with StockStory today.
StockStory is growing and hiring equity analyst and marketing roles. Are you a 0 to 1 builder passionate about the markets and AI? See the open roles here.