
Over the past six months, Huntington Ingalls has been a great trade, beating the S&P 500 by 18.9%. Its stock price has climbed to $303.49, representing a healthy 33.1% increase. This was partly due to its solid quarterly results, and the run-up might have investors contemplating their next move.
Is there a buying opportunity in Huntington Ingalls, or does it present a risk to your portfolio? See what our analysts have to say in our full research report, it’s free for active Edge members.
Why Do We Think Huntington Ingalls Will Underperform?
We’re glad investors have benefited from the price increase, but we don't have much confidence in Huntington Ingalls. Here are three reasons there are better opportunities than HII and a stock we'd rather own.
1. Weak Backlog Growth Points to Soft Demand
We can better understand Defense Contractors companies by analyzing their backlog. This metric shows the value of outstanding orders that have not yet been executed or delivered, giving visibility into Huntington Ingalls’s future revenue streams.
Huntington Ingalls’s backlog came in at $55.68 billion in the latest quarter, and over the last two years, its year-on-year growth averaged 4.9%. This performance was underwhelming and suggests that increasing competition is causing challenges in winning new orders. 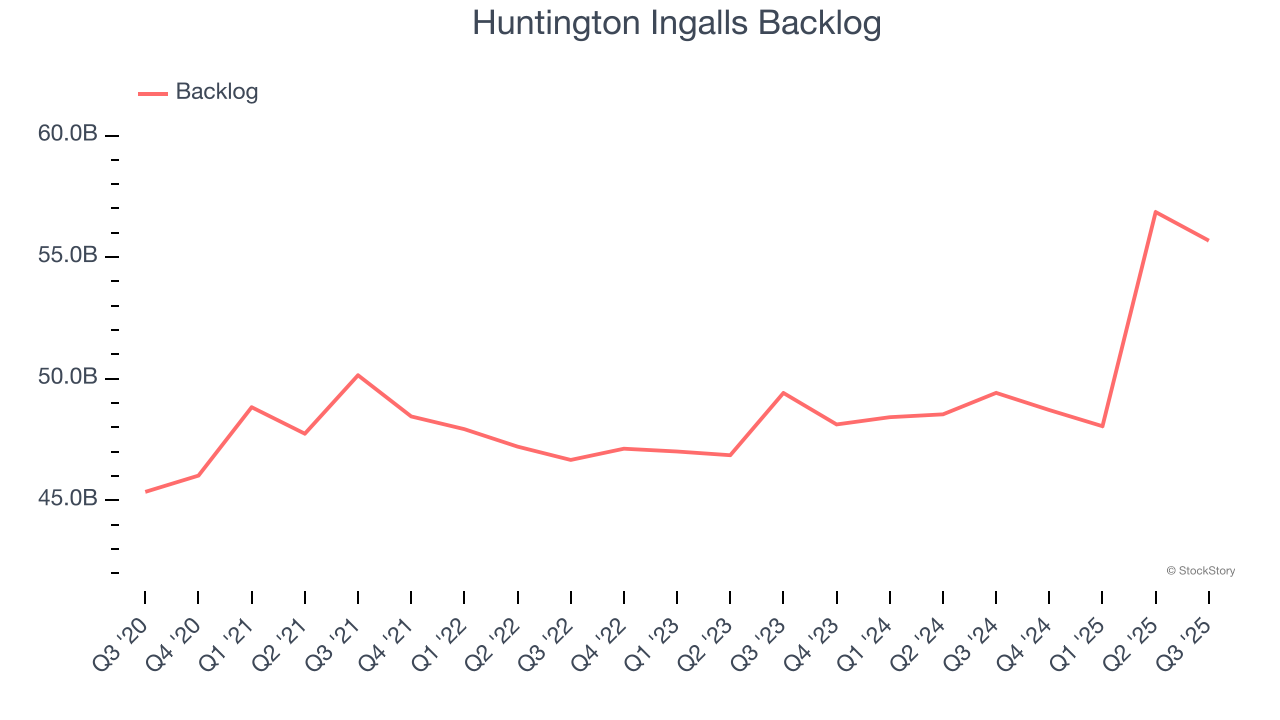
2. EPS Trending Down
Analyzing the long-term change in earnings per share (EPS) shows whether a company's incremental sales were profitable – for example, revenue could be inflated through excessive spending on advertising and promotions.
Sadly for Huntington Ingalls, its EPS declined by 1.1% annually over the last five years while its revenue grew by 5.9%. This tells us the company became less profitable on a per-share basis as it expanded.

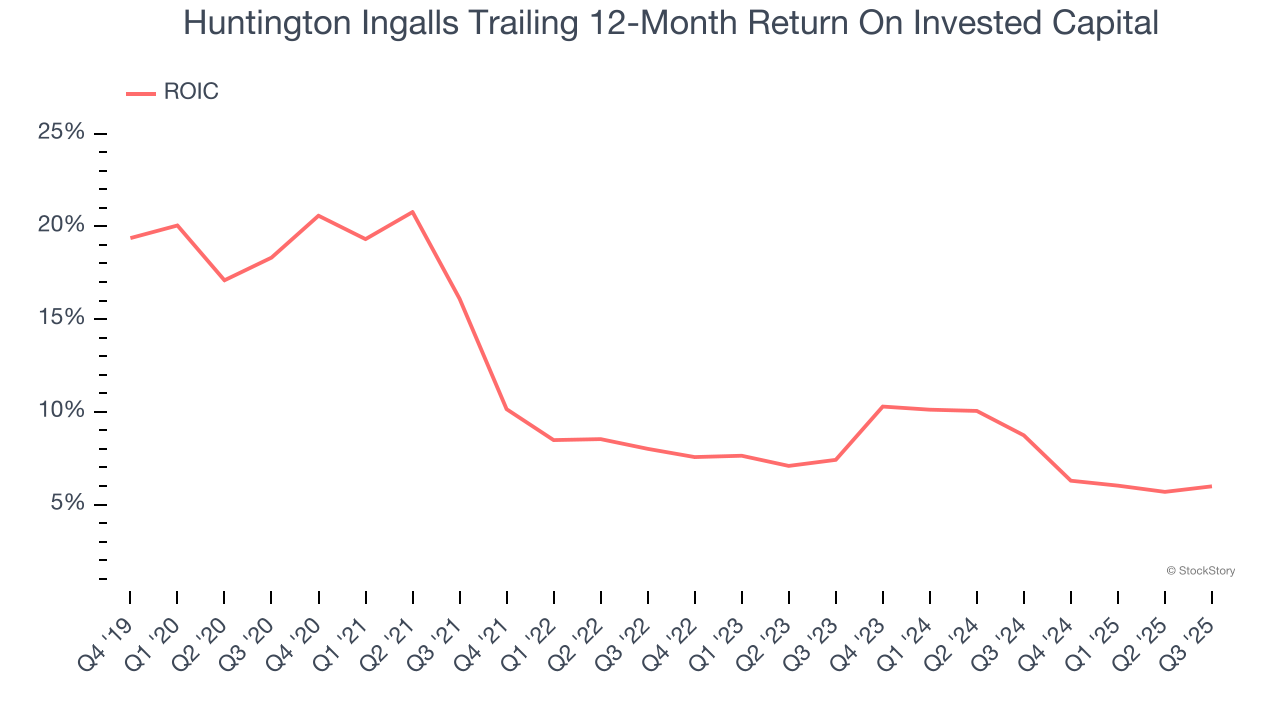
3. New Investments Fail to Bear Fruit as ROIC Declines
ROIC, or return on invested capital, is a metric showing how much operating profit a company generates relative to the money it has raised (debt and equity).
We like to invest in businesses with high returns, but the trend in a company’s ROIC is what often surprises the market and moves the stock price. Over the last few years, Huntington Ingalls’s ROIC averaged 4.7 percentage point decreases each year. Paired with its already low returns, these declines suggest its profitable growth opportunities are few and far between.
Final Judgment
We see the value of companies helping their customers, but in the case of Huntington Ingalls, we’re out. With its shares topping the market in recent months, the stock trades at 19.5× forward P/E (or $303.49 per share). At this valuation, there’s a lot of good news priced in - we think there are better stocks to buy right now. Let us point you toward our favorite semiconductor picks and shovels play.
Stocks We Would Buy Instead of Huntington Ingalls
Your portfolio can’t afford to be based on yesterday’s story. The risk in a handful of heavily crowded stocks is rising daily.
The names generating the next wave of massive growth are right here in our Top 6 Stocks for this week. This is a curated list of our High Quality stocks that have generated a market-beating return of 244% over the last five years (as of June 30, 2025).
Stocks that have made our list include now familiar names such as Nvidia (+1,326% between June 2020 and June 2025) as well as under-the-radar businesses like the once-micro-cap company Kadant (+351% five-year return). Find your next big winner with StockStory today.
StockStory is growing and hiring equity analyst and marketing roles. Are you a 0 to 1 builder passionate about the markets and AI? See the open roles here.


