Avery Dennison currently trades at $175.16 per share and has shown little upside over the past six months, posting a small loss of 2.5%. The stock also fell short of the S&P 500’s 14.3% gain during that period.
Is there a buying opportunity in Avery Dennison, or does it present a risk to your portfolio? Check out our in-depth research report to see what our analysts have to say, it’s free for active Edge members.
Why Is Avery Dennison Not Exciting?
We're sitting this one out for now. Here are three reasons why AVY doesn't excite us and a stock we'd rather own.
1. Slow Organic Growth Suggests Waning Demand In Core Business
In addition to reported revenue, organic revenue is a useful data point for analyzing Industrial Packaging companies. This metric gives visibility into Avery Dennison’s core business because it excludes one-time events such as mergers, acquisitions, and divestitures along with foreign currency fluctuations - non-fundamental factors that can manipulate the income statement.
Over the last two years, Avery Dennison’s organic revenue averaged 2.5% year-on-year growth. This performance was underwhelming and suggests it may need to improve its products, pricing, or go-to-market strategy, which can add an extra layer of complexity to its operations. 
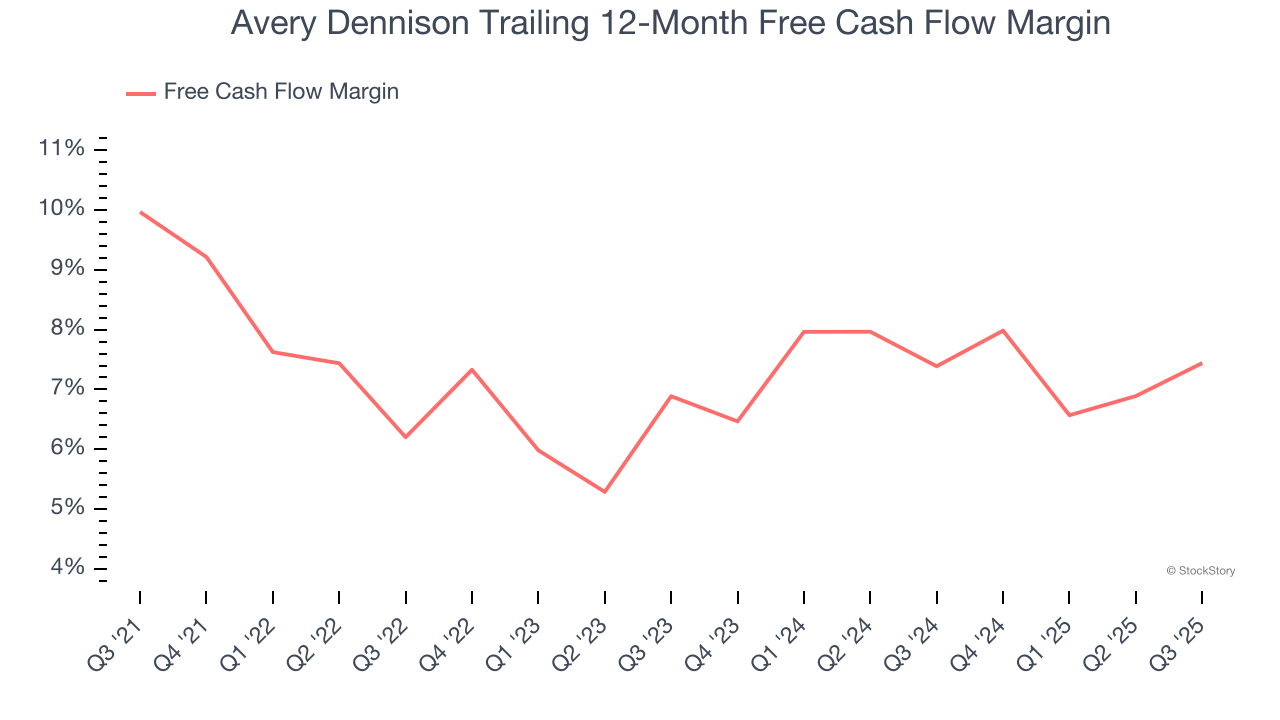
2. Free Cash Flow Margin Dropping
Free cash flow isn't a prominently featured metric in company financials and earnings releases, but we think it's telling because it accounts for all operating and capital expenses, making it tough to manipulate. Cash is king.
As you can see below, Avery Dennison’s margin dropped by 2.5 percentage points over the last five years. If its declines continue, it could signal increasing investment needs and capital intensity. Avery Dennison’s free cash flow margin for the trailing 12 months was 7.4%.
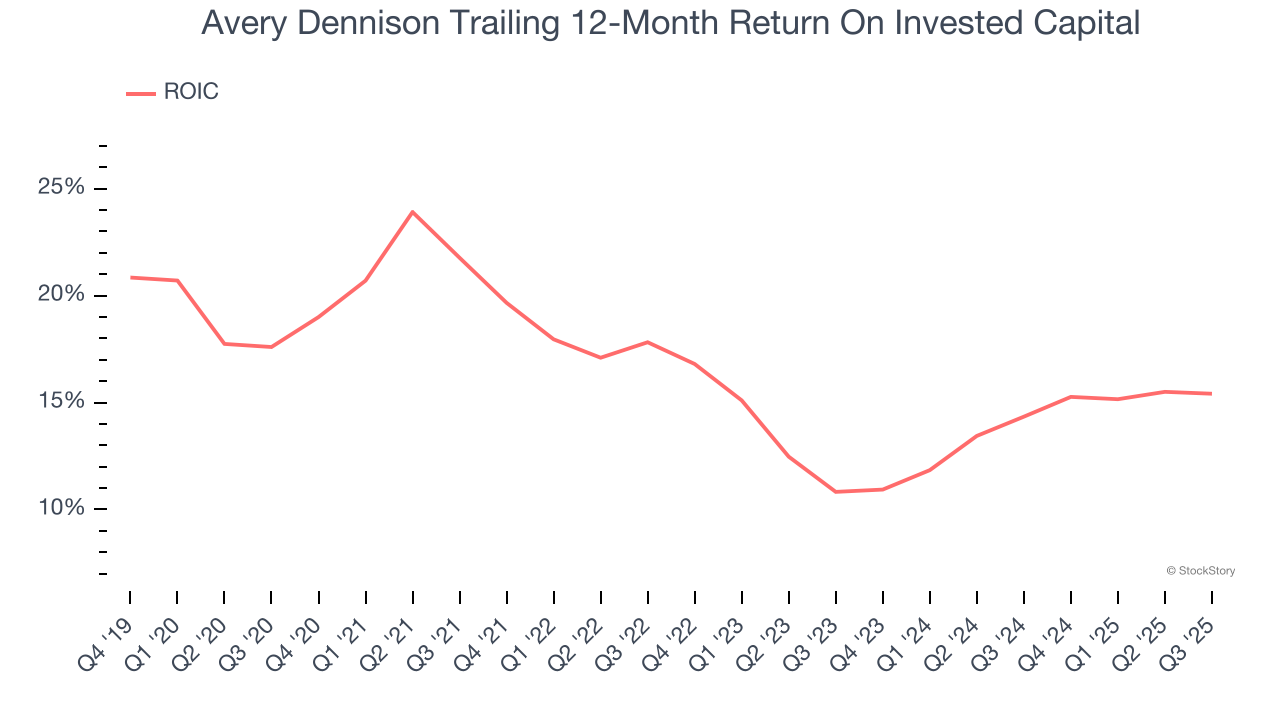
3. New Investments Fail to Bear Fruit as ROIC Declines
A company’s ROIC, or return on invested capital, shows how much operating profit it makes compared to the money it has raised (debt and equity).
We like to invest in businesses with high returns, but the trend in a company’s ROIC is what often surprises the market and moves the stock price. On average, Avery Dennison’s ROIC decreased by 4.9 percentage points annually over the last few years. We like what management has done in the past, but its declining returns are perhaps a symptom of fewer profitable growth opportunities.
Final Judgment
Avery Dennison isn’t a terrible business, but it doesn’t pass our quality test. With its shares lagging the market recently, the stock trades at 17.7× forward P/E (or $175.16 per share). This valuation is reasonable, but the company’s shakier fundamentals present too much downside risk. We're pretty confident there are superior stocks to buy right now. We’d suggest looking at an all-weather company that owns household favorite Taco Bell.
Stocks We Like More Than Avery Dennison
If your portfolio success hinges on just 4 stocks, your wealth is built on fragile ground. You have a small window to secure high-quality assets before the market widens and these prices disappear.
Don’t wait for the next volatility shock. Check out our Top 6 Stocks for this week. This is a curated list of our High Quality stocks that have generated a market-beating return of 244% over the last five years (as of June 30, 2025).
Stocks that have made our list include now familiar names such as Nvidia (+1,326% between June 2020 and June 2025) as well as under-the-radar businesses like the once-small-cap company Exlservice (+354% five-year return). Find your next big winner with StockStory today.
StockStory is growing and hiring equity analyst and marketing roles. Are you a 0 to 1 builder passionate about the markets and AI? See the open roles here.