
Footwear company Caleres (NYSE: CAL) reported revenue ahead of Wall Streets expectations in Q3 CY2025, with sales up 6.6% year on year to $790.1 million. Its non-GAAP profit of $0.38 per share was 55.5% below analysts’ consensus estimates.
Is now the time to buy Caleres? Find out by accessing our full research report, it’s free for active Edge members.
Caleres (CAL) Q3 CY2025 Highlights:
- Revenue: $790.1 million vs analyst estimates of $768.6 million (6.6% year-on-year growth, 2.8% beat)
- Adjusted EPS: $0.38 vs analyst expectations of $0.85 (55.5% miss)
- Adjusted EPS guidance for the full year is $0.58 at the midpoint, missing analyst estimates by 66.7%
- Operating Margin: 1.5%, down from 8% in the same quarter last year
- Free Cash Flow was -$13.93 million compared to -$57.37 million in the same quarter last year
- Market Capitalization: $456.5 million
“Caleres delivered third quarter sales results that were ahead of our internal expectations, highlighted by organic sales growth in our Brand Portfolio segment, strong Lead Brands performance, sequential improvement in trends at Famous Footwear, and accelerated eCommerce momentum in both segments of our business,” said Jay Schmidt, president and chief executive officer.
Company Overview
The owner of Dr. Scholl's, Caleres (NYSE: CAL) is a footwear company offering a range of styles.
Revenue Growth
A company’s long-term performance is an indicator of its overall quality. Any business can put up a good quarter or two, but the best consistently grow over the long haul. Regrettably, Caleres’s sales grew at a weak 3.8% compounded annual growth rate over the last five years. This fell short of our benchmark for the consumer discretionary sector and is a rough starting point for our analysis.
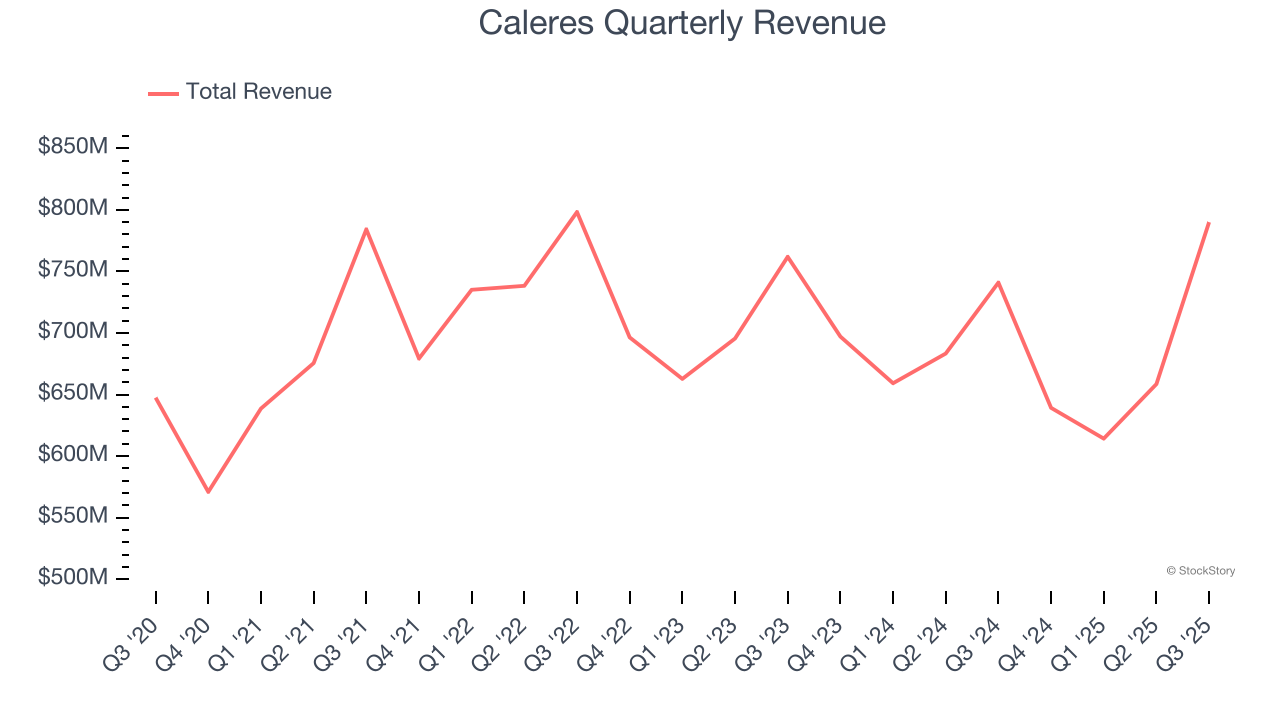
Long-term growth is the most important, but within consumer discretionary, product cycles are short and revenue can be hit-driven due to rapidly changing trends and consumer preferences. Caleres’s performance shows it grew in the past but relinquished its gains over the last two years, as its revenue fell by 2.1% annually. 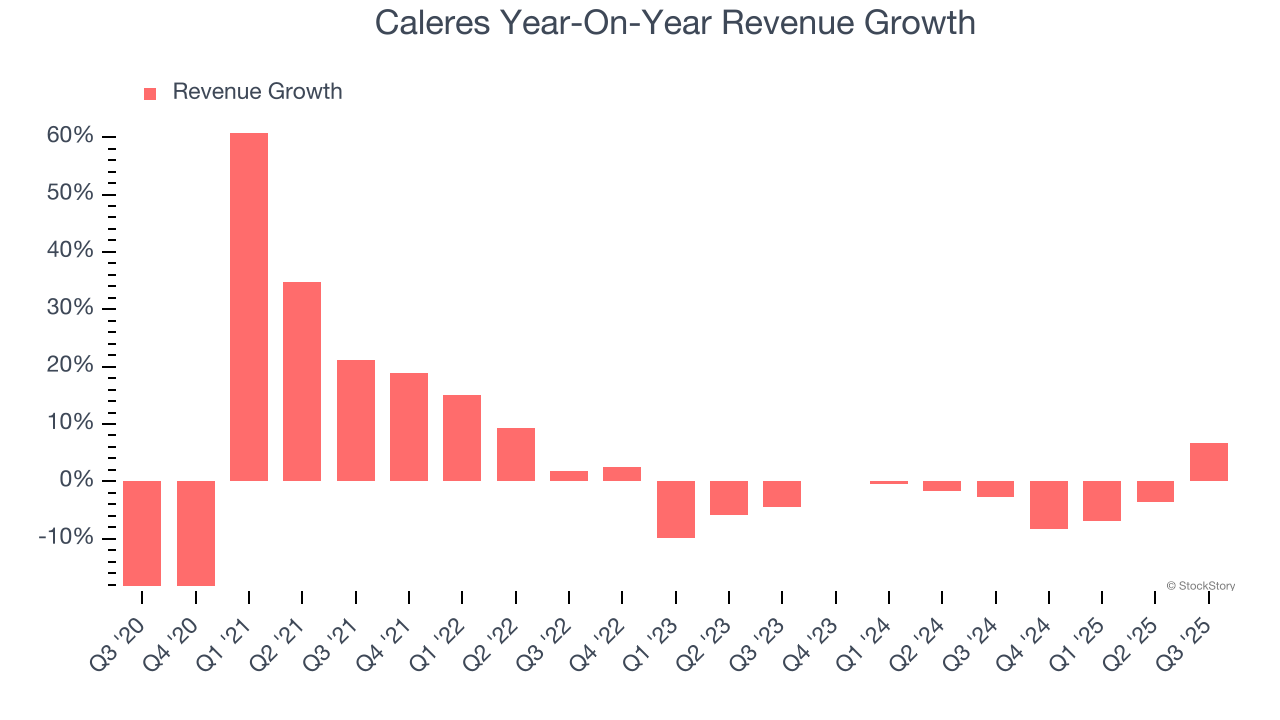
This quarter, Caleres reported year-on-year revenue growth of 6.6%, and its $790.1 million of revenue exceeded Wall Street’s estimates by 2.8%.
Looking ahead, sell-side analysts expect revenue to grow 6.8% over the next 12 months. While this projection indicates its newer products and services will spur better top-line performance, it is still below average for the sector.
The 1999 book Gorilla Game predicted Microsoft and Apple would dominate tech before it happened. Its thesis? Identify the platform winners early. Today, enterprise software companies embedding generative AI are becoming the new gorillas. a profitable, fast-growing enterprise software stock that is already riding the automation wave and looking to catch the generative AI next.
Operating Margin
Operating margin is an important measure of profitability as it shows the portion of revenue left after accounting for all core expenses – everything from the cost of goods sold to advertising and wages. It’s also useful for comparing profitability across companies with different levels of debt and tax rates because it excludes interest and taxes.
Caleres’s operating margin has been trending down over the last 12 months and averaged 4.3% over the last two years. The company’s profitability was mediocre for a consumer discretionary business and shows it couldn’t pass its higher operating expenses onto its customers.
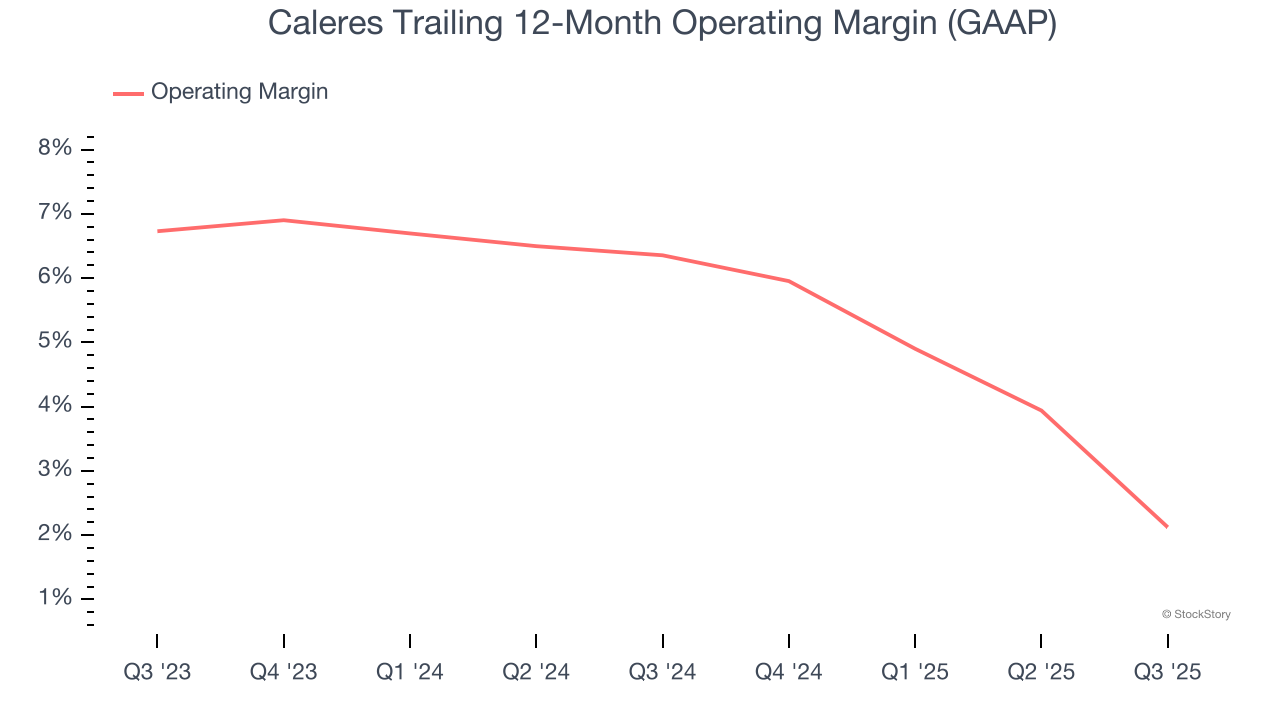
This quarter, Caleres generated an operating margin profit margin of 1.5%, down 6.5 percentage points year on year. This contraction shows it was less efficient because its expenses grew faster than its revenue.
Earnings Per Share
We track the long-term change in earnings per share (EPS) for the same reason as long-term revenue growth. Compared to revenue, however, EPS highlights whether a company’s growth is profitable.
Caleres’s full-year EPS flipped from negative to positive over the last five years. This is encouraging and shows it’s at a critical moment in its life.
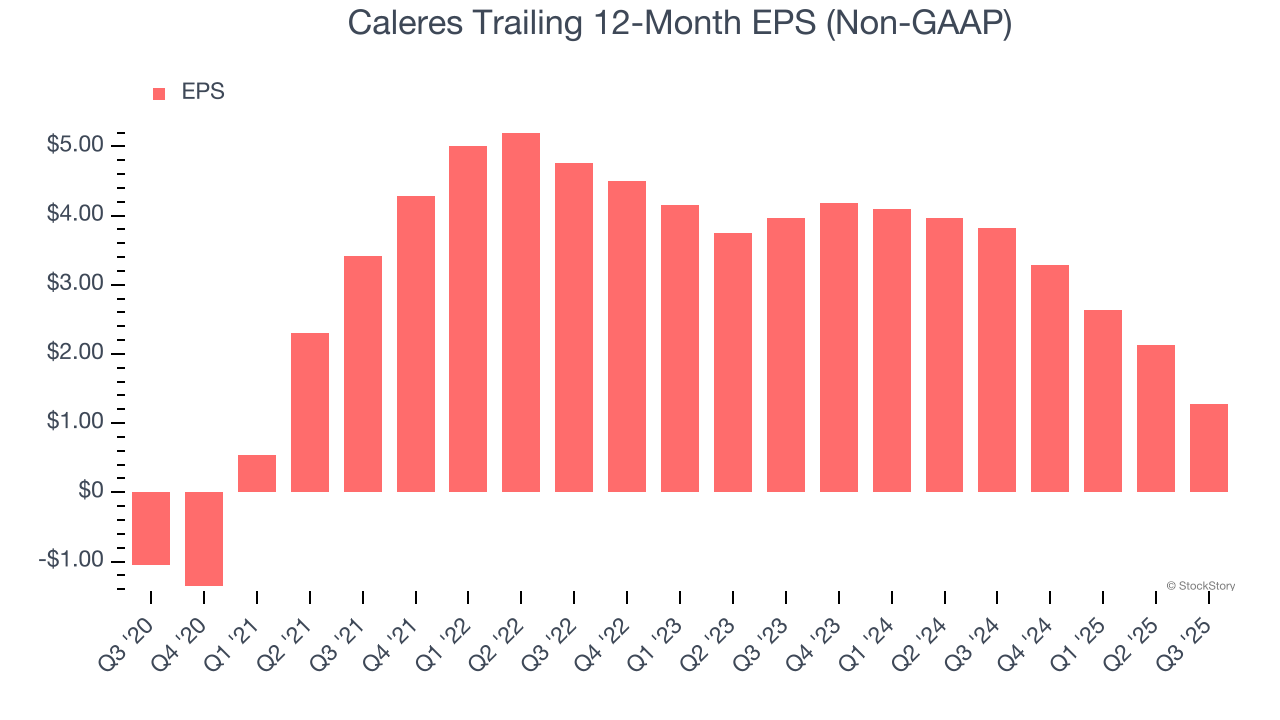
In Q3, Caleres reported adjusted EPS of $0.38, down from $1.23 in the same quarter last year. This print missed analysts’ estimates. Over the next 12 months, Wall Street expects Caleres’s full-year EPS of $1.28 to grow 86.2%.
Key Takeaways from Caleres’s Q3 Results
It was encouraging to see Caleres beat analysts’ revenue expectations this quarter. On the other hand, its full-year EPS guidance missed and its EPS fell short of Wall Street’s estimates. Overall, this was a softer quarter. The stock traded down 20.9% to $10.70 immediately after reporting.
Caleres didn’t show it’s best hand this quarter, but does that create an opportunity to buy the stock right now? If you’re making that decision, you should consider the bigger picture of valuation, business qualities, as well as the latest earnings. We cover that in our actionable full research report which you can read here, it’s free for active Edge members.


