
Packaged food company Campbell's (NASDAQ: CPB) reported Q3 CY2025 results topping the market’s revenue expectations, but sales fell by 3.4% year on year to $2.68 billion. Its non-GAAP profit of $0.77 per share was 5% above analysts’ consensus estimates.
Is now the time to buy Campbell's? Find out by accessing our full research report, it’s free for active Edge members.
Campbell's (CPB) Q3 CY2025 Highlights:
- Revenue: $2.68 billion vs analyst estimates of $2.65 billion (3.4% year-on-year decline, 0.9% beat)
- Adjusted EPS: $0.77 vs analyst estimates of $0.73 (5% beat)
- Adjusted EBITDA: $448 million vs analyst estimates of $479.2 million (16.7% margin, 6.5% miss)
- Management reiterated its full-year Adjusted EPS guidance of $2.47 at the midpoint
- Operating Margin: 12.6%, in line with the same quarter last year
- Free Cash Flow Margin: 3.6%, similar to the same quarter last year
- Organic Revenue fell 1% year on year vs analyst estimates of 2.4% declines (136.7 basis point beat)
- Sales Volumes fell 3% year on year (0% in the same quarter last year)
- Market Capitalization: $8.94 billion
Company Overview
With its iconic canned soup as its cornerstone product, Campbell's (NASDAQ: CPB) is a packaged food company with an illustrious portfolio of brands.
Revenue Growth
A company’s long-term sales performance can indicate its overall quality. Even a bad business can shine for one or two quarters, but a top-tier one grows for years.
With $10.16 billion in revenue over the past 12 months, Campbell's is one of the larger consumer staples companies and benefits from a well-known brand that influences purchasing decisions. However, its scale is a double-edged sword because it’s harder to find incremental growth when your existing brands have penetrated most of the market. For Campbell's to boost its sales, it likely needs to adjust its prices, launch new offerings, or lean into foreign markets.
As you can see below, Campbell's grew its sales at a tepid 4.5% compounded annual growth rate over the last three years as it failed to grow its volumes. We’ll explore what this means in the "Volume Growth" section.
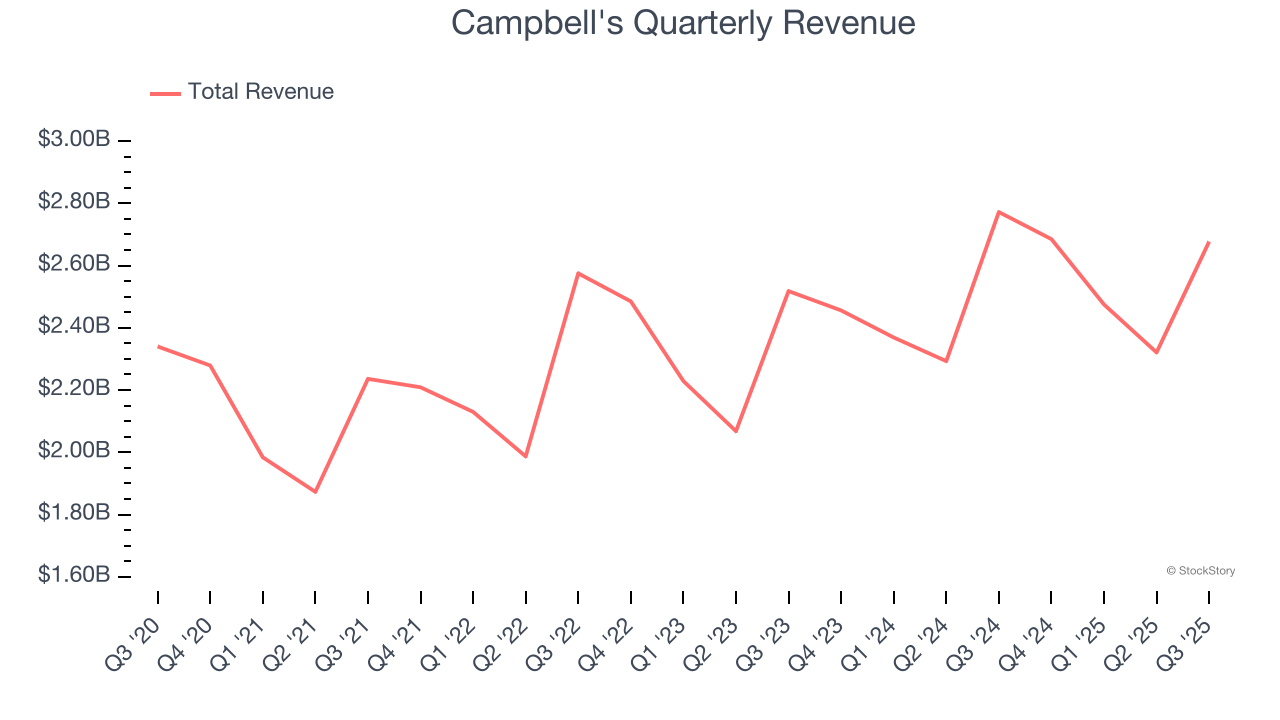
This quarter, Campbell’s revenue fell by 3.4% year on year to $2.68 billion but beat Wall Street’s estimates by 0.9%.
Looking ahead, sell-side analysts expect revenue to decline by 2.1% over the next 12 months, a deceleration versus the last three years. This projection doesn't excite us and implies its products will see some demand headwinds.
While Wall Street chases Nvidia at all-time highs, an under-the-radar semiconductor supplier is dominating a critical AI component these giants can’t build without. Click here to access our free report one of our favorites growth stories.
Volume Growth
Revenue growth can be broken down into changes in price and volume (the number of units sold). While both are important, volume is the lifeblood of a successful staples business as there’s a ceiling to what consumers will pay for everyday goods; they can always trade down to non-branded products if the branded versions are too expensive.
To analyze whether Campbell's generated its growth (or lack thereof) from changes in price or volume, we can compare its volume growth to its organic revenue growth, which excludes non-fundamental impacts on company financials like mergers and currency fluctuations.
Over the last two years, Campbell’s quarterly sales volumes have, on average, stayed about the same, normal for a consumer staples company. In the context of its shrinking organic sales, however, we can deduce that it was only able to maintain its volume by cutting prices and discounting its products. Lower selling prices, regardless of a company’s quality, are a headwind to higher profit margins.
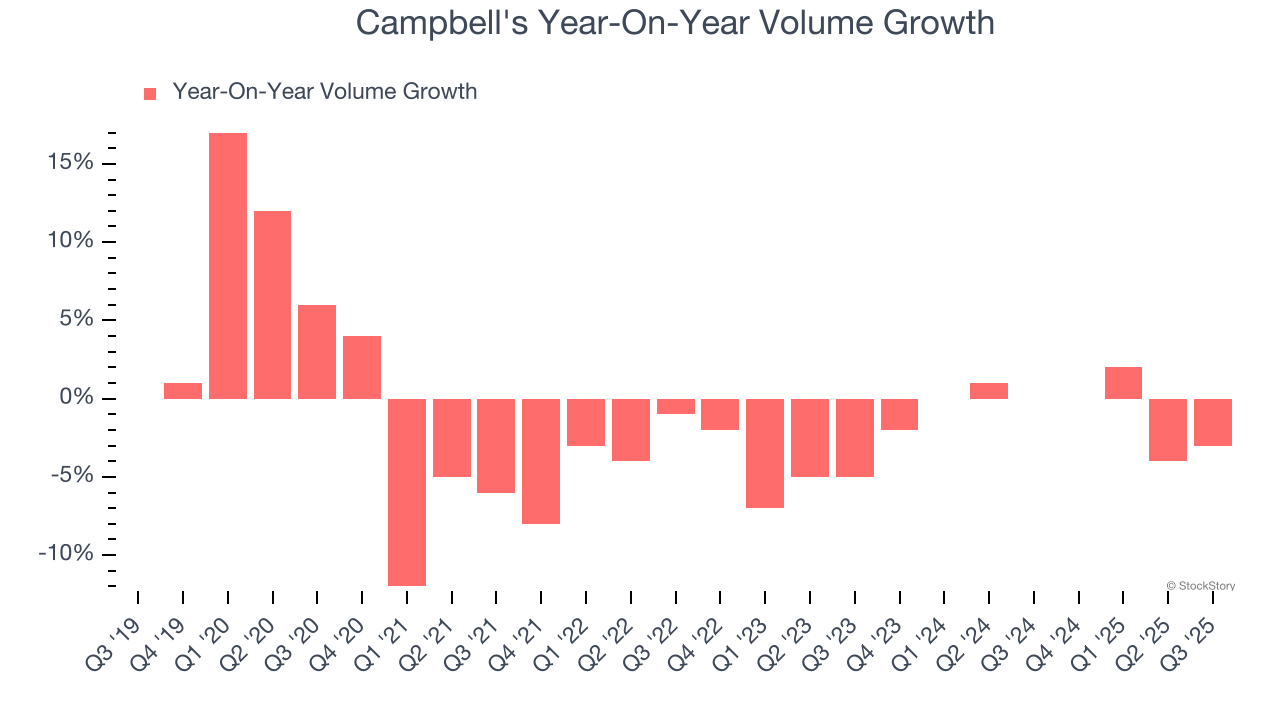
In Campbell’s Q3 2026, sales volumes dropped 3% year on year. This result represents a further deceleration from its historical levels, showing the business is struggling to move its products.
Key Takeaways from Campbell’s Q3 Results
It was good to see Campbell's narrowly top analysts’ organic revenue expectations this quarter. We were also happy its revenue narrowly outperformed Wall Street’s estimates. On the other hand, its EBITDA missed and its gross margin fell short of Wall Street’s estimates. Overall, this quarter could have been better. The stock remained flat at $29.96 immediately after reporting.
Should you buy the stock or not? We think that the latest quarter is only one piece of the longer-term business quality puzzle. Quality, when combined with valuation, can help determine if the stock is a buy. We cover that in our actionable full research report which you can read here, it’s free for active Edge members.


