
Myriad Genetics’s 38.9% return over the past six months has outpaced the S&P 500 by 24.6%, and its stock price has climbed to $7.21 per share. This was partly due to its solid quarterly results, and the run-up might have investors contemplating their next move.
Is there a buying opportunity in Myriad Genetics, or does it present a risk to your portfolio? Dive into our full research report to see our analyst team’s opinion, it’s free for active Edge members.
Why Do We Think Myriad Genetics Will Underperform?
We’re glad investors have benefited from the price increase, but we're cautious about Myriad Genetics. Here are three reasons why MYGN doesn't excite us and a stock we'd rather own.
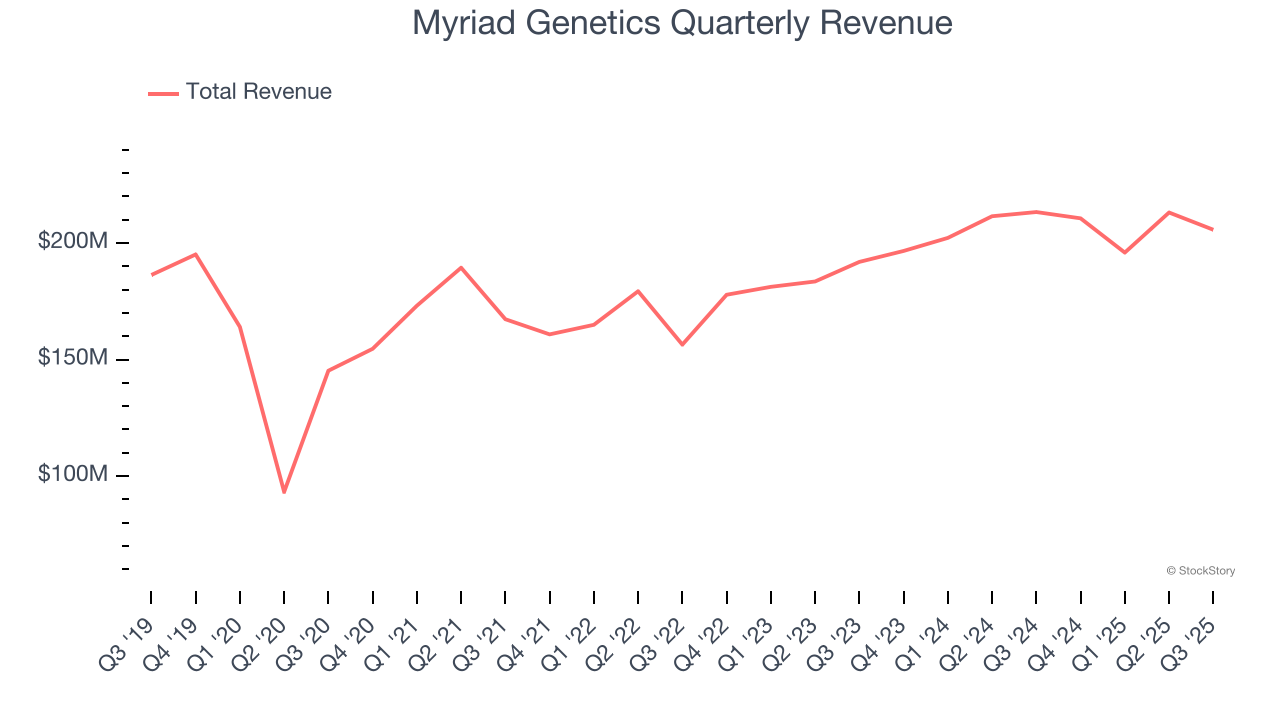
1. Long-Term Revenue Growth Disappoints
A company’s long-term sales performance can indicate its overall quality. Any business can experience short-term success, but top-performing ones enjoy sustained growth for years. Unfortunately, Myriad Genetics’s 6.7% annualized revenue growth over the last five years was mediocre. This fell short of our benchmark for the healthcare sector.
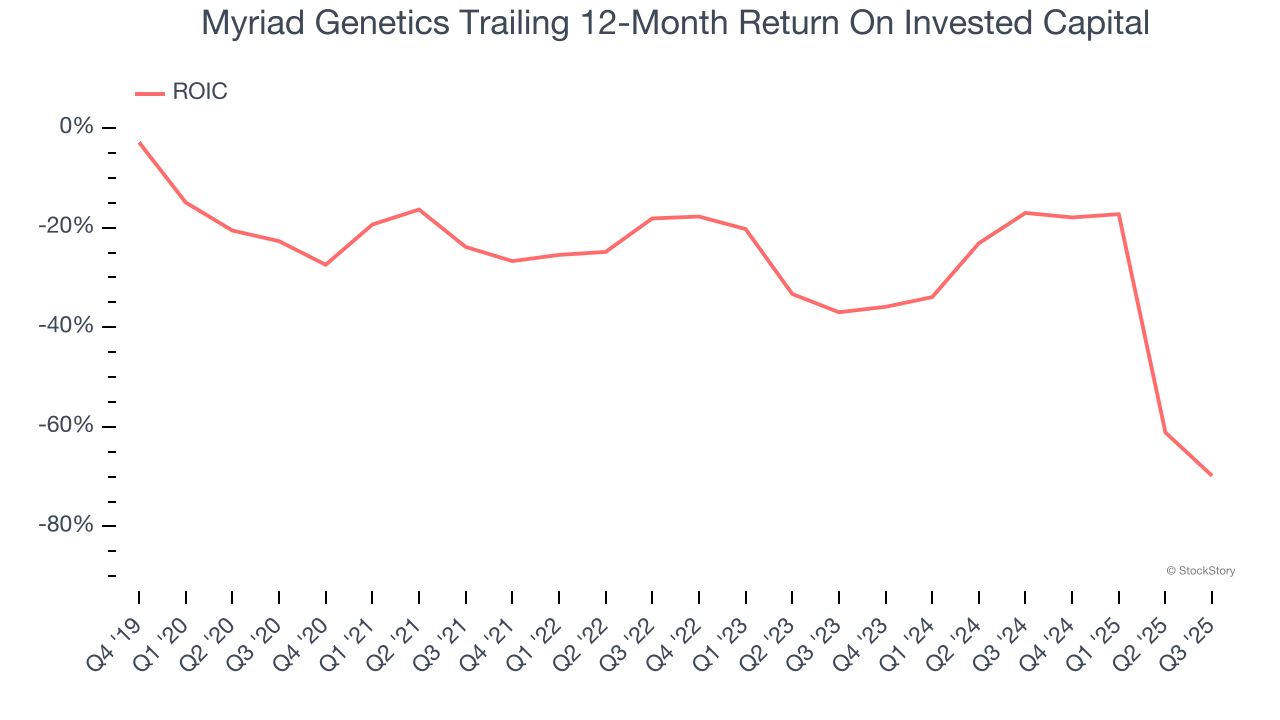
2. Previous Growth Initiatives Have Lost Money
Growth gives us insight into a company’s long-term potential, but how capital-efficient was that growth? Enter ROIC, a metric showing how much operating profit a company generates relative to the money it has raised (debt and equity).
Myriad Genetics’s five-year average ROIC was negative 33.2%, meaning management lost money while trying to expand the business. Its returns were among the worst in the healthcare sector.

3. New Investments Fail to Bear Fruit as ROIC Declines
A company’s ROIC, or return on invested capital, shows how much operating profit it makes compared to the money it has raised (debt and equity).
We like to invest in businesses with high returns, but the trend in a company’s ROIC is what often surprises the market and moves the stock price. Over the last few years, Myriad Genetics’s ROIC has unfortunately decreased significantly. Paired with its already low returns, these declines suggest its profitable growth opportunities are few and far between.
Final Judgment
Myriad Genetics falls short of our quality standards. With its shares beating the market recently, the stock trades at 226.3× forward P/E (or $7.21 per share). This multiple tells us a lot of good news is priced in - we think there are better opportunities elsewhere. We’d recommend looking at a fast-growing restaurant franchise with an A+ ranch dressing sauce.
High-Quality Stocks for All Market Conditions
Your portfolio can’t afford to be based on yesterday’s story. The risk in a handful of heavily crowded stocks is rising daily.
The names generating the next wave of massive growth are right here in our Top 6 Stocks for this week. This is a curated list of our High Quality stocks that have generated a market-beating return of 244% over the last five years (as of June 30, 2025).
Stocks that have made our list include now familiar names such as Nvidia (+1,326% between June 2020 and June 2025) as well as under-the-radar businesses like the once-small-cap company Exlservice (+354% five-year return). Find your next big winner with StockStory today.
StockStory is growing and hiring equity analyst and marketing roles. Are you a 0 to 1 builder passionate about the markets and AI? See the open roles here.


