Clinical research company Medpace Holdings (NASDAQ: MEDP) met Wall Street’s revenue expectations in Q4 CY2024, with sales up 7.7% year on year to $536.6 million. On the other hand, the company’s full-year revenue guidance of $2.16 billion at the midpoint came in 3.5% below analysts’ estimates. Its GAAP profit of $3.67 per share was 24.1% above analysts’ consensus estimates.
Is now the time to buy Medpace? Find out by accessing our full research report, it’s free.
Medpace (MEDP) Q4 CY2024 Highlights:
- Revenue: $536.6 million vs analyst estimates of $534 million (7.7% year-on-year growth, in line)
- EPS (GAAP): $3.67 vs analyst estimates of $2.96 (24.1% beat)
- Adjusted EBITDA: $133.5 million vs analyst estimates of $115.2 million (24.9% margin, 15.9% beat)
- Management’s revenue guidance for the upcoming financial year 2025 is $2.16 billion at the midpoint, missing analyst estimates by 3.5% and implying 2.4% growth (vs 12.1% in FY2024)
- EPS (GAAP) guidance for the upcoming financial year 2025 is $12.31 at the midpoint, missing analyst estimates by 2.6%
- EBITDA guidance for the upcoming financial year 2025 is $477 million at the midpoint, below analyst estimates of $482.1 million
- Operating Margin: 23.4%, up from 17.5% in the same quarter last year
- Free Cash Flow Margin: 34.1%, up from 29.4% in the same quarter last year
- Organic Revenue rose 7.7% year on year (26% in the same quarter last year)
- Market Capitalization: $10.98 billion
Company Overview
Founded in 1992, Medpace Holdings (NASDAQ: MEDP) provides full-service clinical development services to pharmaceutical, biotechnology, and medical device companies, specializing in the design and management of complex clinical trials.
Drug Development Inputs & Services
Companies specializing in drug development inputs and services play a crucial role in the pharmaceutical and biotechnology value chain. Essential support for drug discovery, preclinical testing, and manufacturing means stable demand, as pharmaceutical companies often outsource non-core functions with medium to long-term contracts. However, the business model faces high capital requirements, customer concentration, and vulnerability to shifts in biopharma R&D budgets or regulatory frameworks. Looking ahead, the industry will likely enjoy tailwinds such as increasing investment in biologics, cell and gene therapies, and advancements in precision medicine, which drive demand for sophisticated tools and services. There is a growing trend of outsourcing in drug development for nimbleness and cost efficiency, which benefits the industry. On the flip side, potential headwinds include pricing pressures as efforts to contain healthcare costs are always top of mind. An evolving regulatory backdrop could also slow innovation or client activity.
Sales Growth
A company’s long-term performance is an indicator of its overall quality. While any business can experience short-term success, top-performing ones enjoy sustained growth for years. Over the last five years, Medpace grew its sales at an impressive 19.6% compounded annual growth rate. Its growth surpassed the average healthcare company and shows its offerings resonate with customers, a great starting point for our analysis.
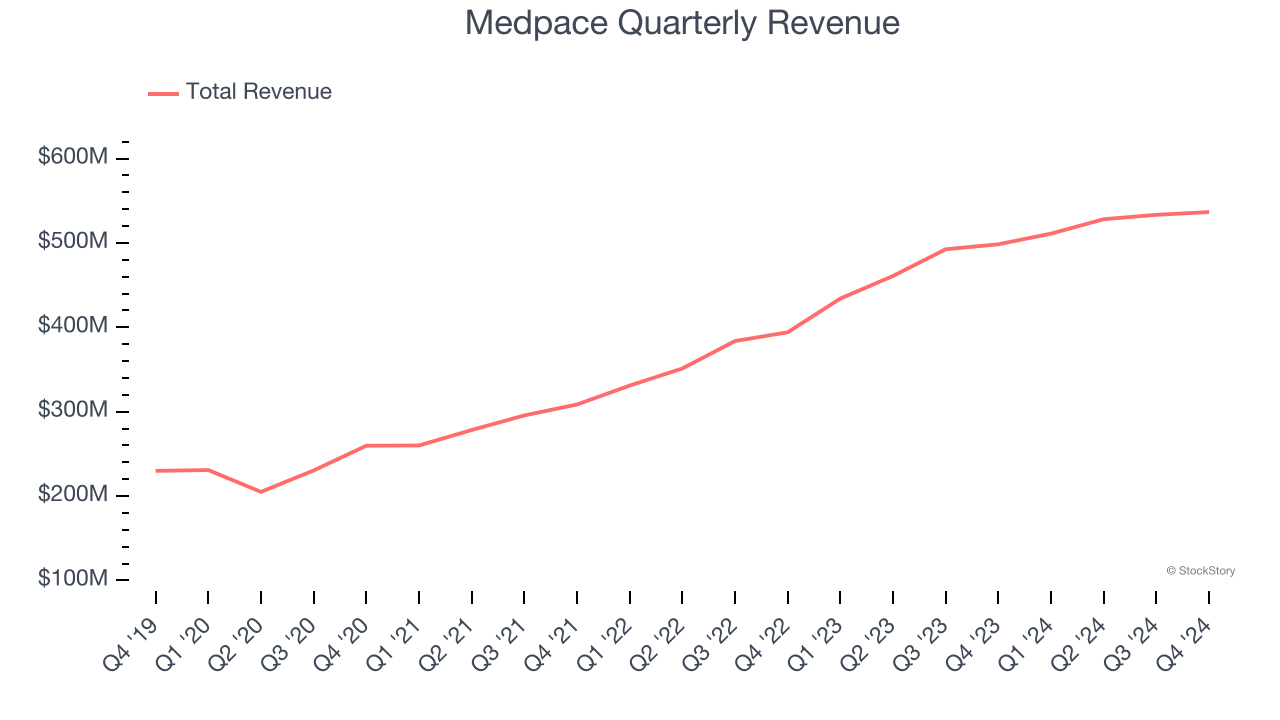
Long-term growth is the most important, but within healthcare, a half-decade historical view may miss new innovations or demand cycles. Medpace’s annualized revenue growth of 20.2% over the last two years aligns with its five-year trend, suggesting its demand was predictably strong. 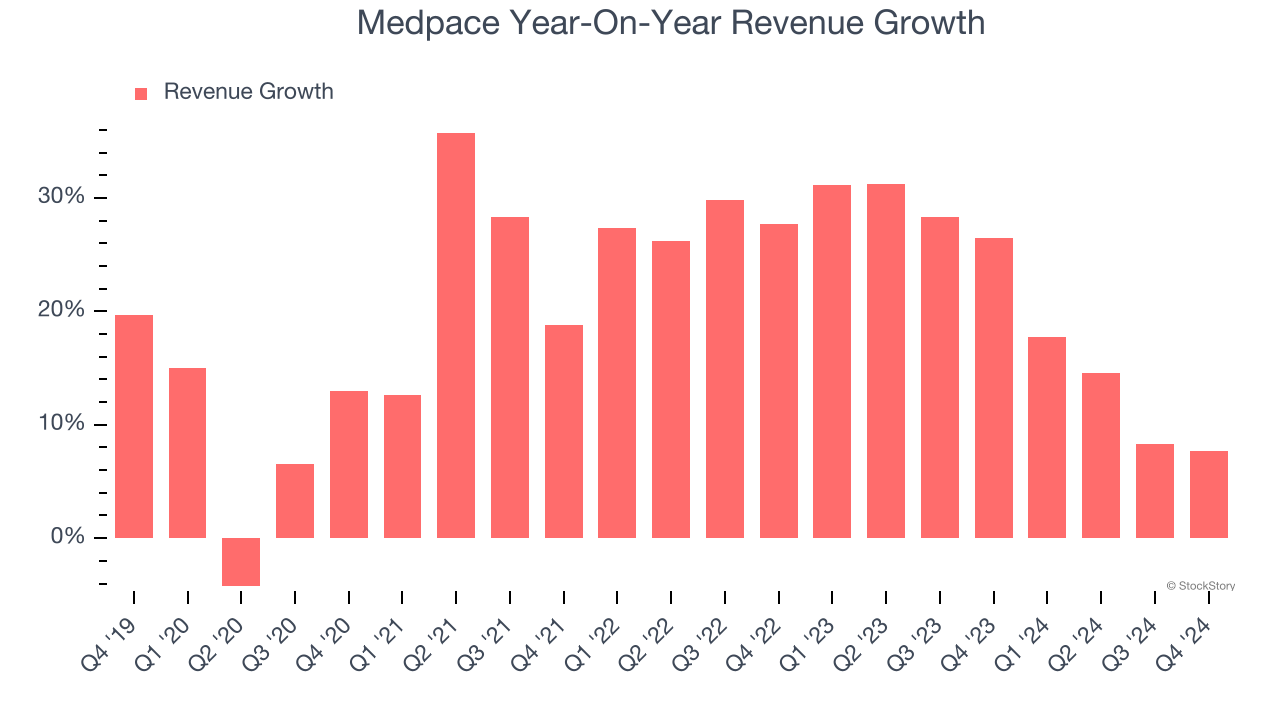
We can better understand the company’s sales dynamics by analyzing its organic revenue, which strips out one-time events like acquisitions and currency fluctuations that don’t accurately reflect its fundamentals. Over the last two years, Medpace’s organic revenue averaged 20.6% year-on-year growth. Because this number aligns with its normal revenue growth, we can see the company’s core operations (not acquisitions and divestitures) drove most of its results. 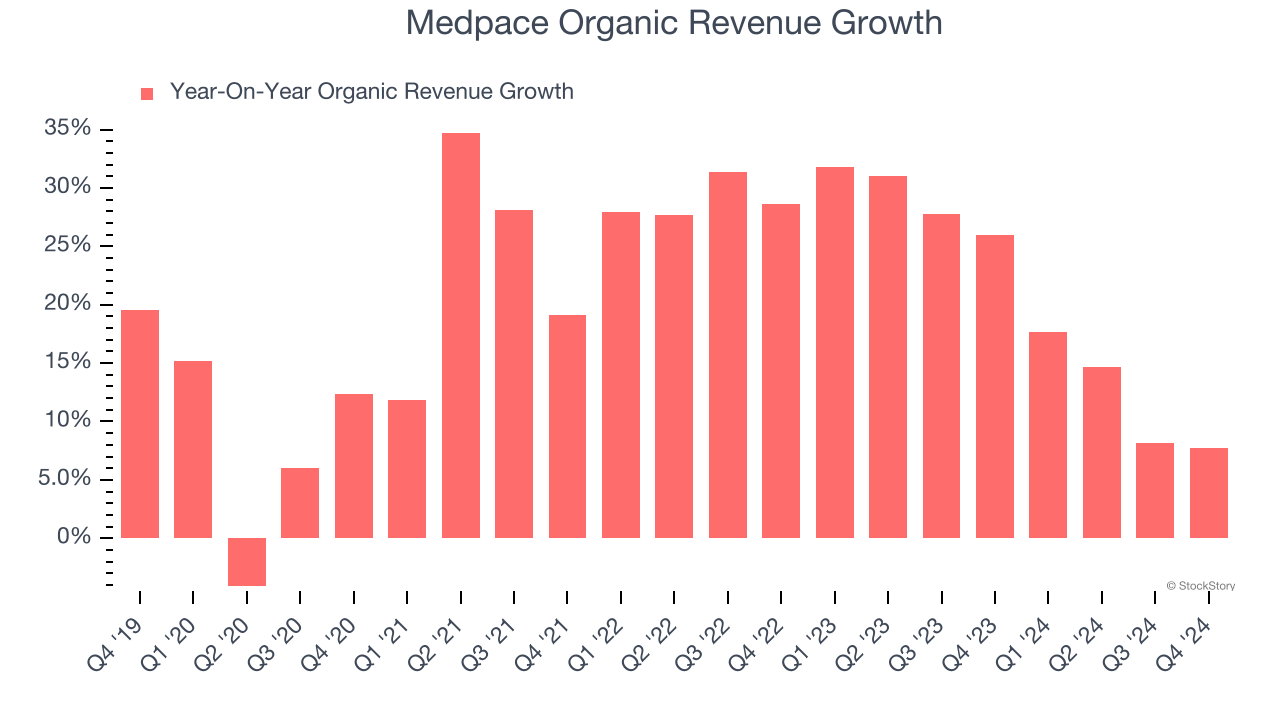
This quarter, Medpace grew its revenue by 7.7% year on year, and its $536.6 million of revenue was in line with Wall Street’s estimates.
Looking ahead, sell-side analysts expect revenue to grow 4.5% over the next 12 months, a deceleration versus the last two years. This projection is underwhelming and implies its products and services will see some demand headwinds. At least the company is tracking well in other measures of financial health.
Unless you’ve been living under a rock, it should be obvious by now that generative AI is going to have a huge impact on how large corporations do business. While Nvidia and AMD are trading close to all-time highs, we prefer a lesser-known (but still profitable) stock benefiting from the rise of AI. Click here to access our free report one of our favorites growth stories.
Operating Margin
Operating margin is one of the best measures of profitability because it tells us how much money a company takes home after subtracting all core expenses, like marketing and R&D.
Medpace has managed its cost base well over the last five years. It demonstrated solid profitability for a healthcare business, producing an average operating margin of 19%.
Looking at the trend in its profitability, Medpace’s operating margin rose by 3.1 percentage points over the last five years, as its sales growth gave it operating leverage. Zooming in on its more recent performance, we can see the company’s trajectory is intact as its margin has also increased by 2.1 percentage points on a two-year basis. These data points are very encouraging and shows momentum is on its side.
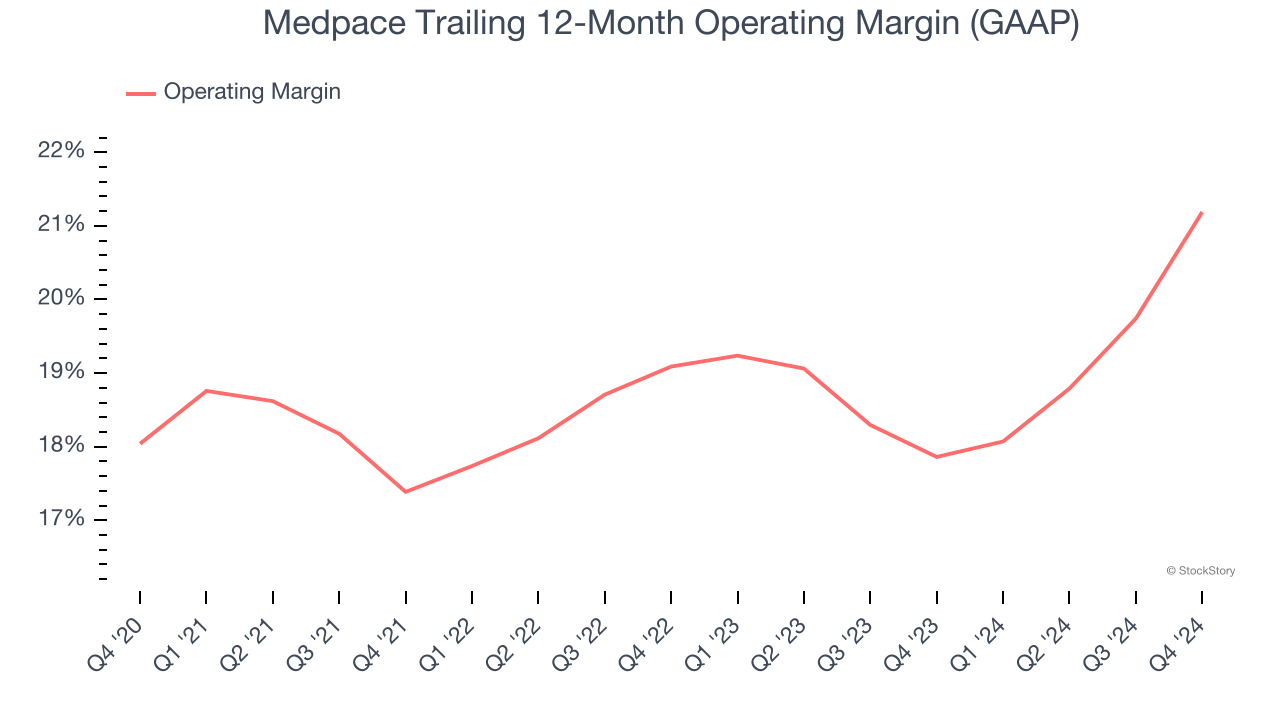
In Q4, Medpace generated an operating profit margin of 23.4%, up 5.8 percentage points year on year. This increase was a welcome development and shows it was recently more efficient because its expenses grew slower than its revenue.
Earnings Per Share
We track the long-term change in earnings per share (EPS) for the same reason as long-term revenue growth. Compared to revenue, however, EPS highlights whether a company’s growth is profitable.
Medpace’s EPS grew at an astounding 36.6% compounded annual growth rate over the last five years, higher than its 19.6% annualized revenue growth. This tells us the company became more profitable on a per-share basis as it expanded.
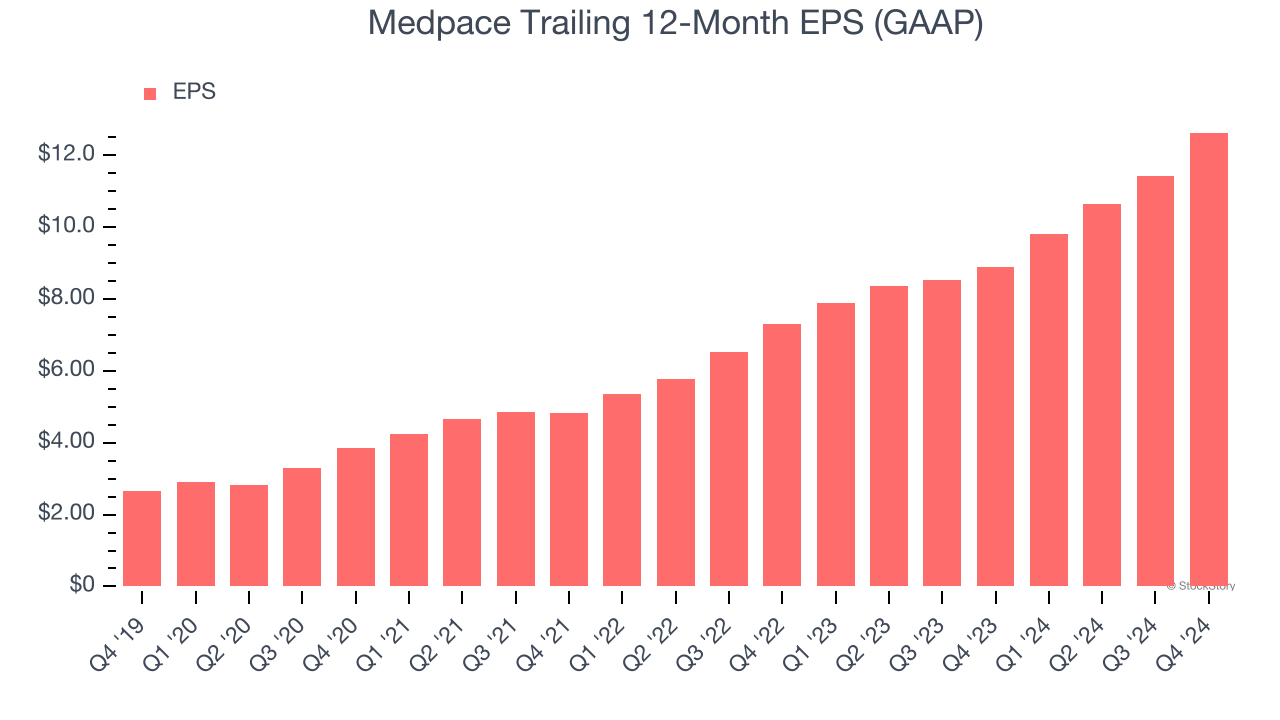
Diving into the nuances of Medpace’s earnings can give us a better understanding of its performance. As we mentioned earlier, Medpace’s operating margin expanded by 3.1 percentage points over the last five years. On top of that, its share count shrank by 16%. These are positive signs for shareholders because improving profitability and share buybacks turbocharge EPS growth relative to revenue growth. 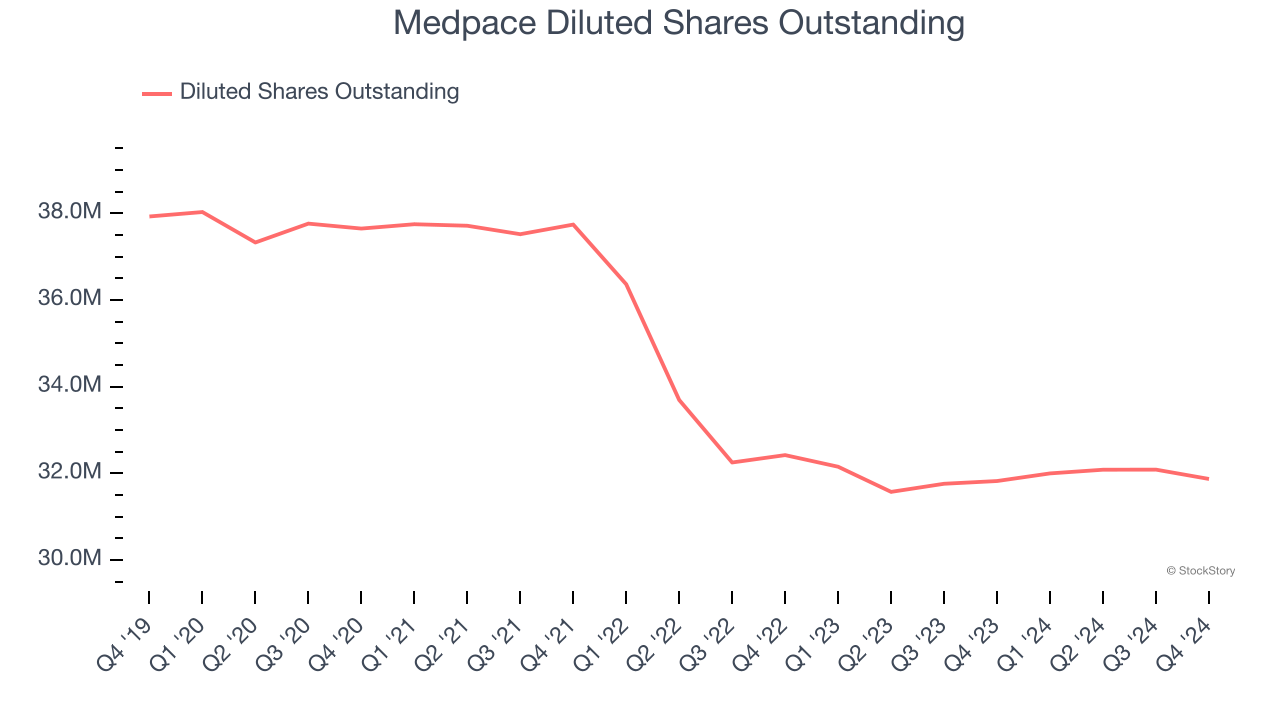
In Q4, Medpace reported EPS at $3.67, up from $2.46 in the same quarter last year. This print easily cleared analysts’ estimates, and shareholders should be content with the results. Over the next 12 months, Wall Street expects Medpace’s full-year EPS of $12.64 to stay about the same.
Key Takeaways from Medpace’s Q4 Results
We enjoyed seeing Medpace exceed analysts’ EPS and EBITDA expectations this quarter. On the other hand, its full-year revenue, EPS, and EBITDA guidance fell short of Wall Street’s estimates. Overall, this quarter could have been better. The stock traded down 8.1% to $324.93 immediately following the results.
Medpace may have had a tough quarter, but does that actually create an opportunity to invest right now? If you’re making that decision, you should consider the bigger picture of valuation, business qualities, as well as the latest earnings. We cover that in our actionable full research report which you can read here, it’s free.