Wrapping up Q4 earnings, we look at the numbers and key takeaways for the industrial packaging stocks, including Packaging Corporation of America (NYSE: PKG) and its peers.
Industrial packaging companies have built competitive advantages from economies of scale that lead to advantaged purchasing and capital investments that are difficult and expensive to replicate. Recently, eco-friendly packaging and conservation are driving customers preferences and innovation. For example, plastic is not as desirable a material as it once was. Despite being integral to consumer goods ranging from beer to toothpaste to laundry detergent, these companies are still at the whim of the macro, especially consumer health and consumer willingness to spend.
The 7 industrial packaging stocks we track reported a slower Q4. As a group, revenues missed analysts’ consensus estimates by 1%.
While some industrial packaging stocks have fared somewhat better than others, they have collectively declined. On average, share prices are down 4.8% since the latest earnings results.
Packaging Corporation of America (NYSE: PKG)
Founded in 1959, Packaging Corporation of America (NYSE: PKG) produces containerboard and corrugated packaging products as well as displays and package protection.
Packaging Corporation of America reported revenues of $2.15 billion, up 10.7% year on year. This print exceeded analysts’ expectations by 0.6%. Despite the top-line beat, it was still a mixed quarter for the company with a solid beat of analysts’ sales volume estimates but EPS guidance for next quarter missing analysts’ expectations significantly.
Commenting on reported results, Mark W. Kowlzan, Chairman and CEO, said, “As we have seen throughout the year, demand in our Packaging segment during the quarter remained very strong.”
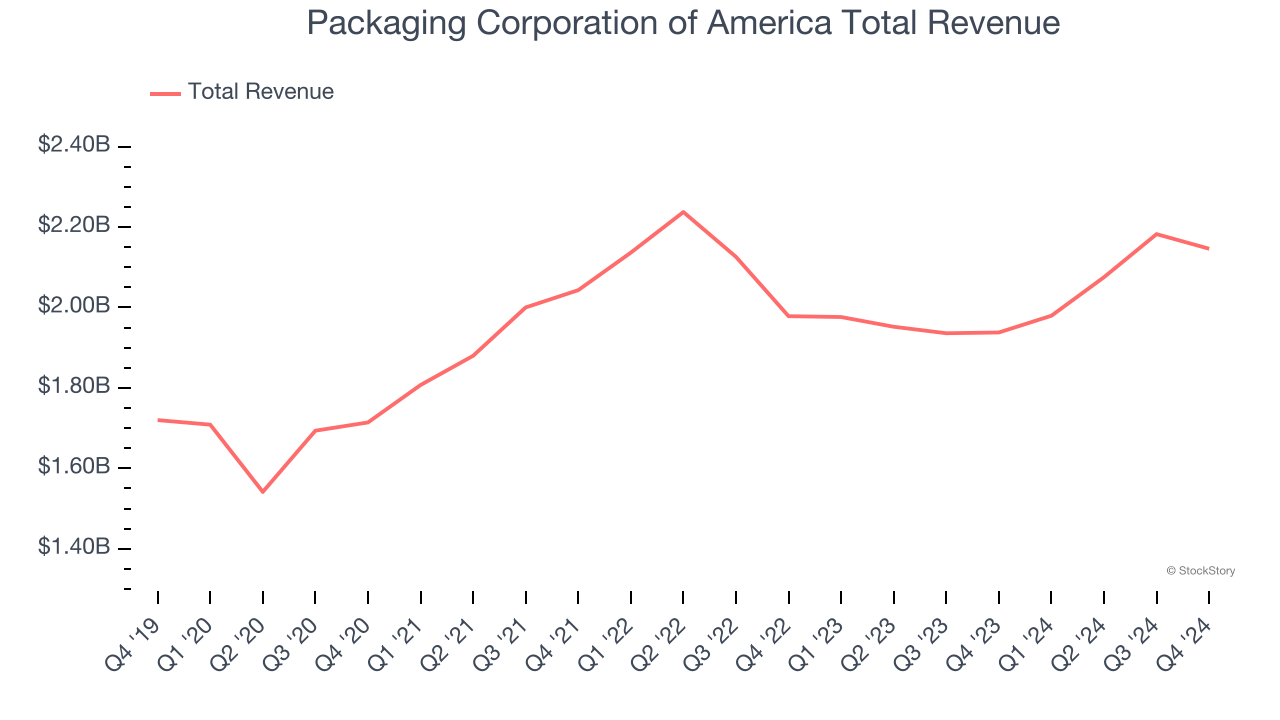
Packaging Corporation of America scored the biggest analyst estimates beat and fastest revenue growth of the whole group. Still, the market seems discontent with the results. The stock is down 2.2% since reporting and currently trades at $210.22.
Read our full report on Packaging Corporation of America here, it’s free.
Best Q4: Crown Holdings (NYSE: CCK)
Formerly Crown Cork & Seal, Crown Holdings (NYSE: CCK) produces packaging products for consumer marketing companies, including food, beverage, household, and industrial products.
Crown Holdings reported revenues of $2.90 billion, up 1.6% year on year, in line with analysts’ expectations. The business had a satisfactory quarter, with EPS guidance for the next quarter exceeding analysts’ expectations but a miss of analysts’ constant currency revenue estimates.
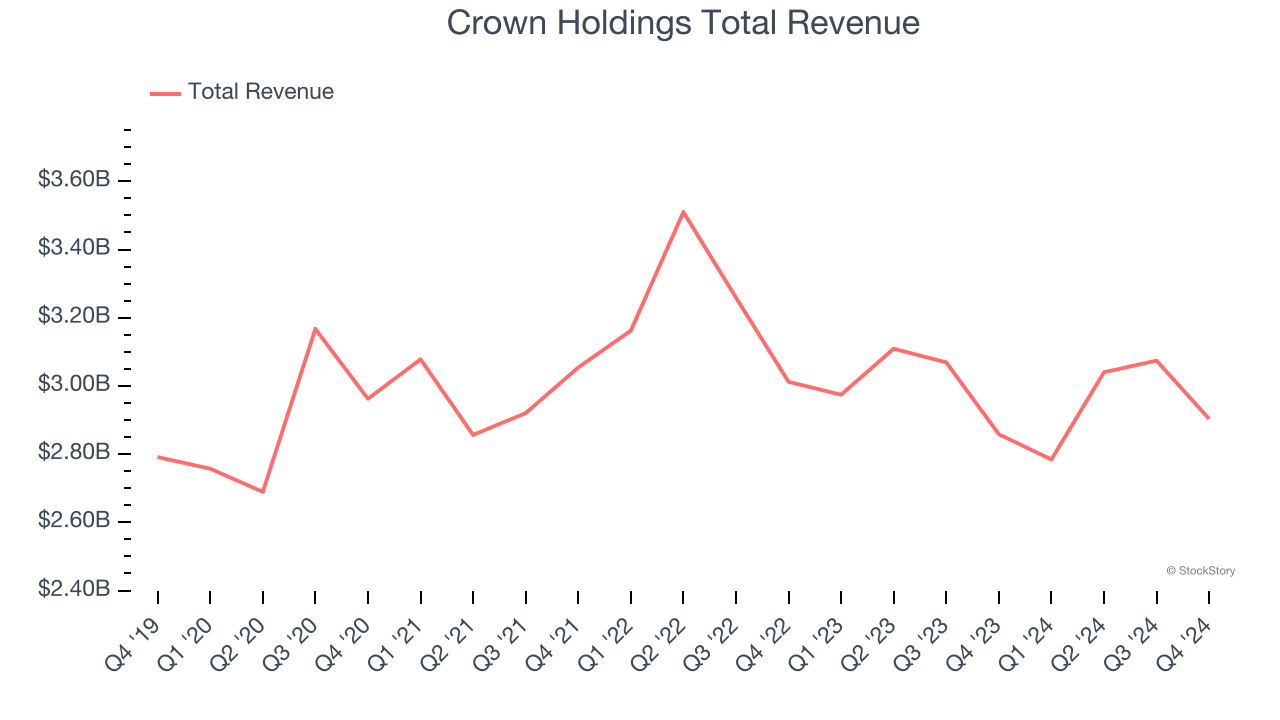
The market seems content with the results as the stock is up 2.2% since reporting. It currently trades at $86.96.
Is now the time to buy Crown Holdings? Access our full analysis of the earnings results here, it’s free.
Weakest Q4: International Paper (NYSE: IP)
Established in 1898, International Paper (NYSE: IP) produces containerboard, pulp, paper, and materials used in packaging and printing applications.
International Paper reported revenues of $4.58 billion, flat year on year, falling short of analysts’ expectations by 3.8%. It was a disappointing quarter as it posted a significant miss of analysts’ adjusted operating income and EPS estimates.
International Paper delivered the weakest performance against analyst estimates in the group. As expected, the stock is down 3.5% since the results and currently trades at $56.06.
Read our full analysis of International Paper’s results here.
Silgan Holdings (NYSE: SLGN)
Established in 1987, Silgan Holdings (NYSE: SLGN) is a supplier of rigid packaging for consumer goods products, specializing in metal containers, closures, and plastic packaging.
Silgan Holdings reported revenues of $1.41 billion, up 5.3% year on year. This number was in line with analysts’ expectations. Taking a step back, it was a slower quarter as it recorded a significant miss of analysts’ adjusted operating income estimates.
The stock is up 1.4% since reporting and currently trades at $53.75.
Read our full, actionable report on Silgan Holdings here, it’s free.
Ball (NYSE: BALL)
Started with a $200 loan in 1880, Ball (NYSE: BLL) manufactures aluminum packaging for beverages, personal care, and household products as well as aerospace systems and other technologies.
Ball reported revenues of $2.88 billion, down 15.4% year on year. This print came in 1.9% below analysts' expectations. It was a disappointing quarter as it also recorded a significant miss of analysts’ adjusted operating income estimates.
Ball had the slowest revenue growth among its peers. The stock is down 8.7% since reporting and currently trades at $50.87.
Read our full, actionable report on Ball here, it’s free.
Want to invest in winners with rock-solid fundamentals? Check out our Top 6 Stocks and add them to your watchlist. These companies are poised for growth regardless of the political or macroeconomic climate.
Join Paid Stock Investor Research
Help us make StockStory more helpful to investors like yourself. Join our paid user research session and receive a $50 Amazon gift card for your opinions. Sign up here.