Since August 2024, Sprinklr has been in a holding pattern, posting a small return of 1.7% while floating around $8.99. The stock also fell short of the S&P 500’s 13.2% gain during that period.
Is there a buying opportunity in Sprinklr, or does it present a risk to your portfolio? Get the full breakdown from our expert analysts, it’s free.
We're swiping left on Sprinklr for now. Here are three reasons why we avoid CXM and a stock we'd rather own.
Why Is Sprinklr Not Exciting?
Initially focused only on social media management, Sprinklr (NYSE: CXM) is a leading provider of unified customer experience management software.
1. Weak Billings Point to Soft Demand
Billings is a non-GAAP metric that is often called “cash revenue” because it shows how much money the company has collected from customers in a certain period. This is different from revenue, which must be recognized in pieces over the length of a contract.
Sprinklr’s billings came in at $147.9 million in Q3, and over the last four quarters, its year-on-year growth averaged 7.1%. This performance was underwhelming and suggests that increasing competition is causing challenges in acquiring/retaining customers. 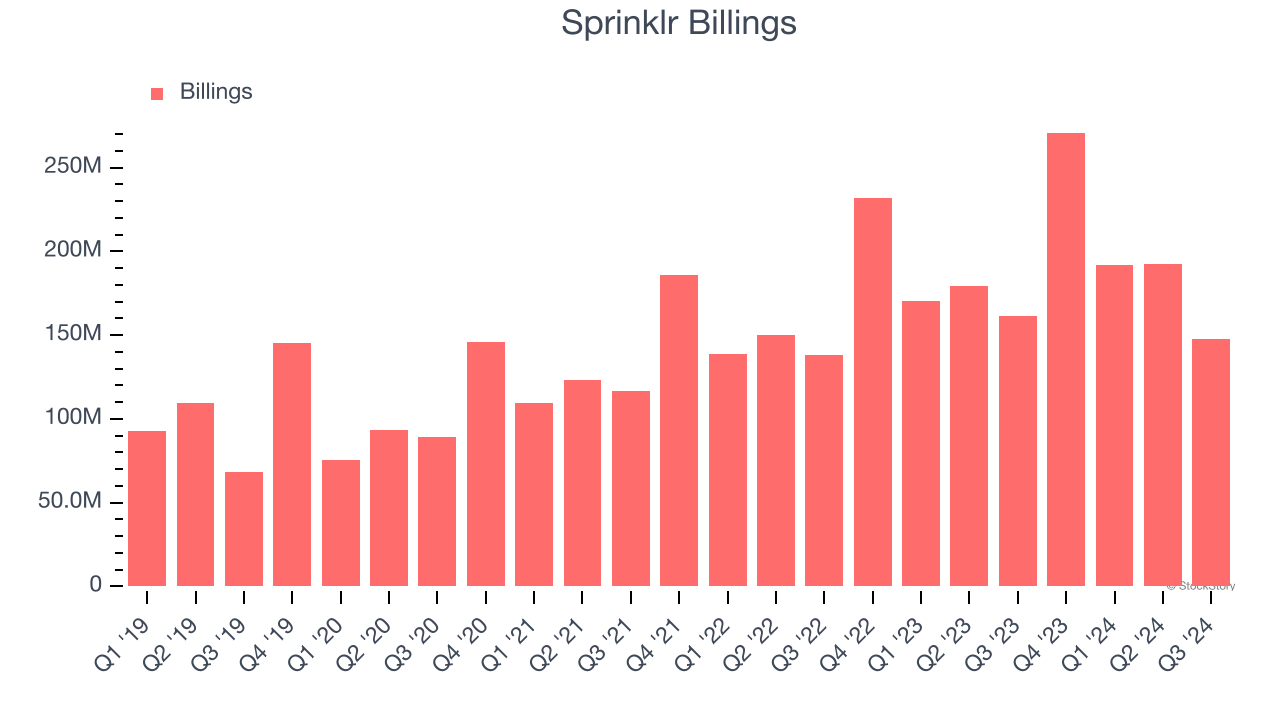
2. Projected Revenue Growth Is Slim
Forecasted revenues by Wall Street analysts signal a company’s potential. Predictions may not always be accurate, but accelerating growth typically boosts valuation multiples and stock prices while slowing growth does the opposite.
Over the next 12 months, sell-side analysts expect Sprinklr’s revenue to rise by 2.9%, a deceleration versus its 19.6% annualized growth for the past three years. This projection is underwhelming and indicates its products and services will face some demand challenges.
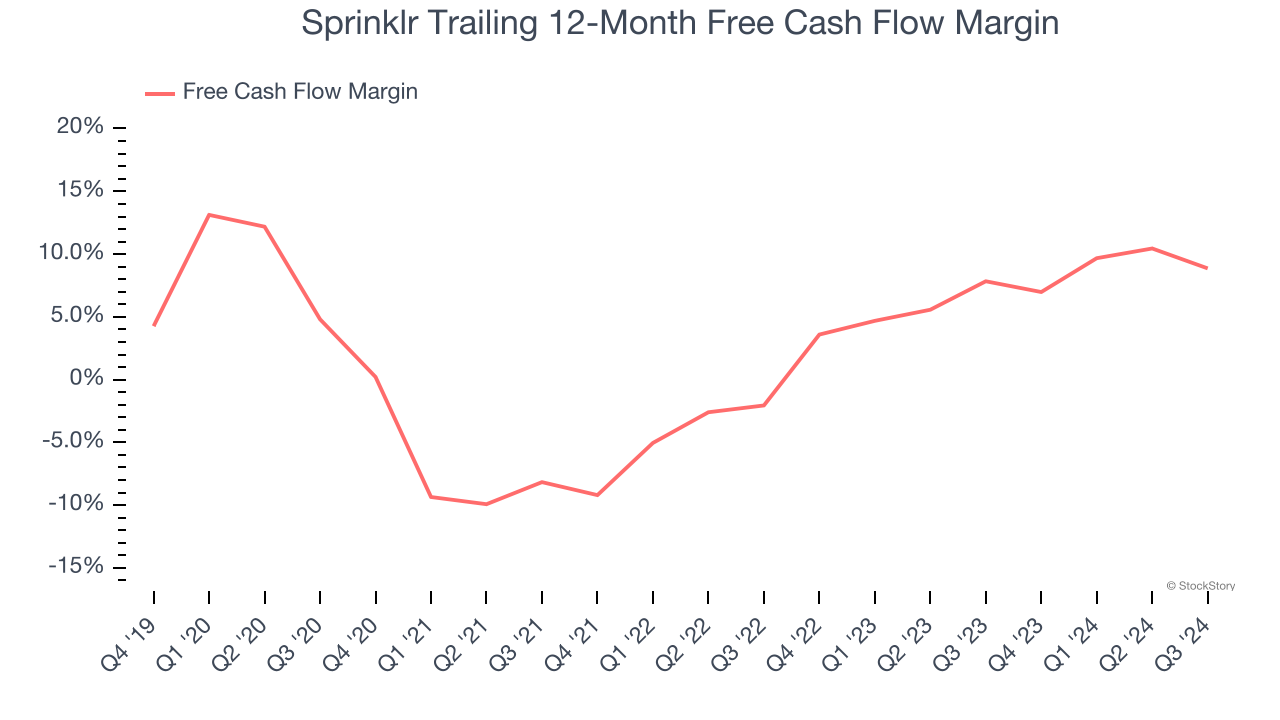
3. Mediocre Free Cash Flow Margin Limits Reinvestment Potential
If you’ve followed StockStory for a while, you know we emphasize free cash flow. Why, you ask? We believe that in the end, cash is king, and you can’t use accounting profits to pay the bills.
Sprinklr has shown mediocre cash profitability over the last year, giving the company limited opportunities to return capital to shareholders. Its free cash flow margin averaged 8.9%, subpar for a software business.
Final Judgment
Sprinklr isn’t a terrible business, but it doesn’t pass our bar. With its shares lagging the market recently, the stock trades at 2.9× forward price-to-sales (or $8.99 per share). This valuation multiple is fair, but we don’t have much faith in the company. We're fairly confident there are better stocks to buy right now. Let us point you toward the most dominant software business in the world.
Stocks We Like More Than Sprinklr
The Trump trade may have passed, but rates are still dropping and inflation is still cooling. Opportunities are ripe for those ready to act - and we’re here to help you pick them.
Get started by checking out our Top 5 Strong Momentum Stocks for this week. This is a curated list of our High Quality stocks that have generated a market-beating return of 175% over the last five years.
Stocks that made our list in 2019 include now familiar names such as Nvidia (+2,183% between December 2019 and December 2024) as well as under-the-radar businesses like Comfort Systems (+751% five-year return). Find your next big winner with StockStory today for free.