Diner restaurant chain Denny’s (NASDAQ: DENN) fell short of the market’s revenue expectations in Q4 CY2024, with sales flat year on year at $114.7 million. Its non-GAAP profit of $0.14 per share was 8.6% below analysts’ consensus estimates.
Is now the time to buy Denny's? Find out by accessing our full research report, it’s free.
Denny's (DENN) Q4 CY2024 Highlights:
- Revenue: $114.7 million vs analyst estimates of $116 million (flat year on year, 1.2% miss)
- Adjusted EPS: $0.14 vs analyst expectations of $0.15 (8.6% miss)
- Adjusted EBITDA: $22.15 million vs analyst estimates of $22.38 million (19.3% margin, 1% miss)
- EBITDA guidance for the upcoming financial year 2025 is $82.5 million at the midpoint, below analyst estimates of $87 million
- Operating Margin: 12.6%, up from 6.7% in the same quarter last year
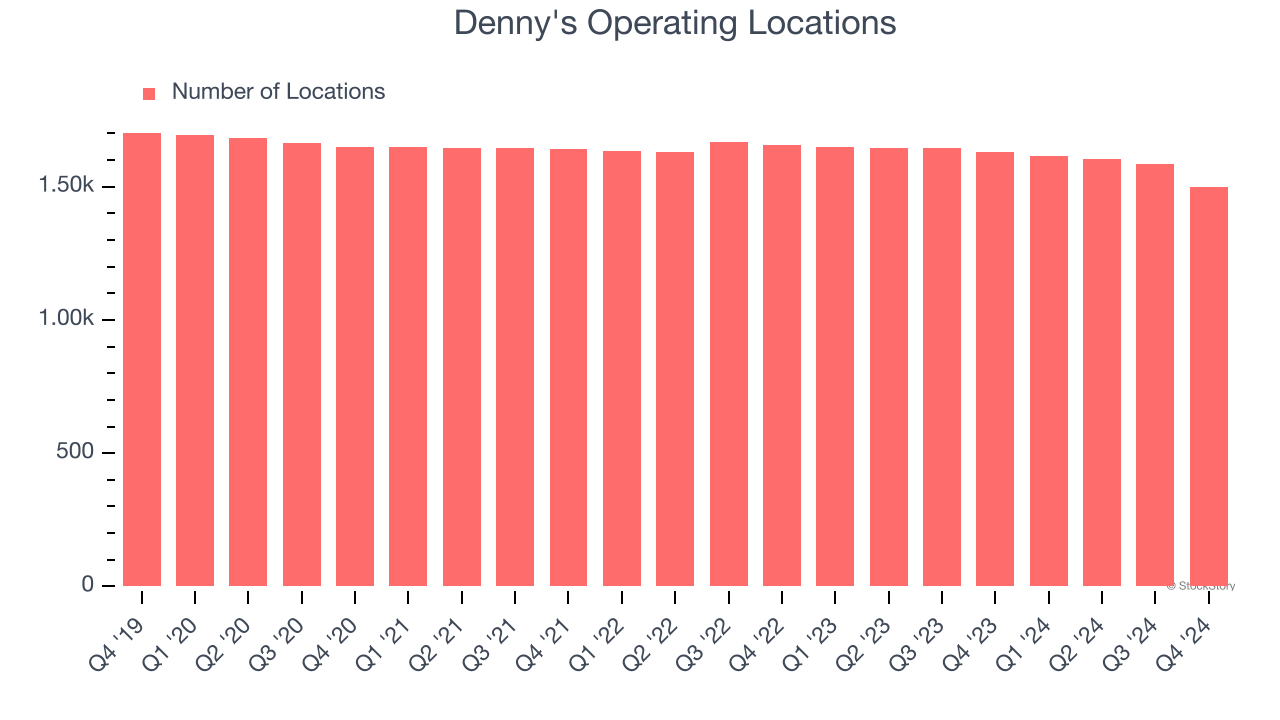
- Locations: 1,499 at quarter end, down from 1,631 in the same quarter last year
- Same-Store Sales rose 1.1% year on year, in line with the same quarter last year
- Market Capitalization: $344.9 million
Kelli Valade, Chief Executive Officer, stated, "We are proud of our progress through 2024, culminating in strong performances from both Denny's and Keke's, which outperformed their respective BBI Family Dining indices in the fourth quarter. We have made significant progress in our strategy to enhance the overall health of our flagship brand by accelerating the closure of lower-volume restaurants and completing 23 remodels, and also opened a record number of Keke’s cafes while expanding into six new states. Looking ahead to 2025, there is still work to be done within our brands, particularly as we navigate near-term consumer sentiment that has been affected by macroeconomic factors. With the actions we are taking to maintain our position as a value leader, invest in our brands, reduce costs, and drive traffic, we are well positioned to deliver shareholder value.”
Company Overview
Open around the clock, Denny’s (NASDAQ: DENN) is a chain of diner restaurants serving breakfast and traditional American fare.
Sit-Down Dining
Sit-down restaurants offer a complete dining experience with table service. These establishments span various cuisines and are renowned for their warm hospitality and welcoming ambiance, making them perfect for family gatherings, special occasions, or simply unwinding. Their extensive menus range from appetizers to indulgent desserts and wines and cocktails. This space is extremely fragmented and competition includes everything from publicly-traded companies owning multiple chains to single-location mom-and-pop restaurants.
Sales Growth
A company’s long-term sales performance can indicate its overall quality. Any business can put up a good quarter or two, but many enduring ones grow for years.
With $452.3 million in revenue over the past 12 months, Denny's is a small restaurant chain, which sometimes brings disadvantages compared to larger competitors benefiting from better brand awareness and economies of scale.
As you can see below, Denny’s demand was weak over the last five years (we compare to 2019 to normalize for COVID-19 impacts). Its sales fell by 3.5% annually as it closed restaurants.
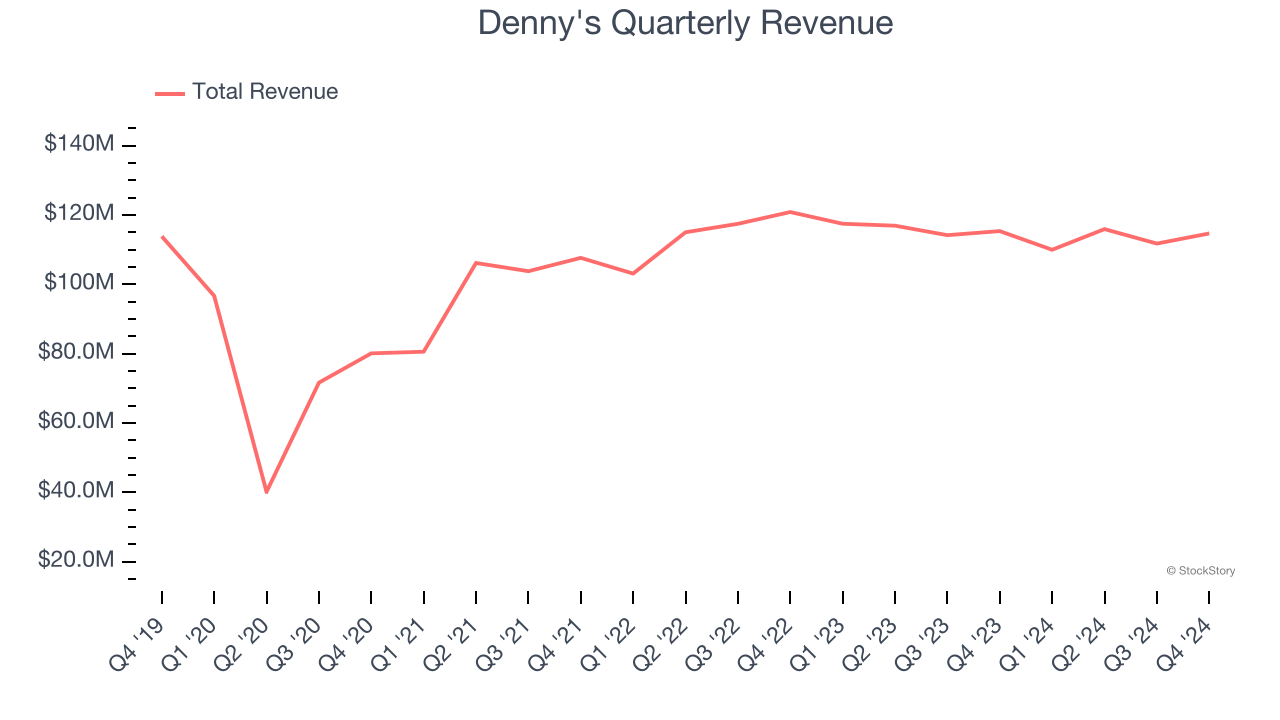
This quarter, Denny's missed Wall Street’s estimates and reported a rather uninspiring 0.6% year-on-year revenue decline, generating $114.7 million of revenue.
Looking ahead, sell-side analysts expect revenue to grow 4.6% over the next 12 months. While this projection suggests its newer menu offerings will catalyze better top-line performance, it is still below the sector average.
Here at StockStory, we certainly understand the potential of thematic investing. Diverse winners from Microsoft (MSFT) to Alphabet (GOOG), Coca-Cola (KO) to Monster Beverage (MNST) could all have been identified as promising growth stories with a megatrend driving the growth. So, in that spirit, we’ve identified a relatively under-the-radar profitable growth stock benefiting from the rise of AI, available to you FREE via this link.
Restaurant Performance
Number of Restaurants
Denny's operated 1,499 locations in the latest quarter. Over the last two years, the company has generally closed its restaurants, averaging 2.2% annual declines.
When a chain shutters restaurants, it usually means demand for its meals is waning, and it is responding by closing underperforming locations to improve profitability.
Same-Store Sales
The change in a company's restaurant base only tells one side of the story. The other is the performance of its existing locations, which informs management teams whether they should expand or downsize their physical footprints. Same-store sales gives us insight into this topic because it measures organic growth at restaurants open for at least a year.
Denny’s demand rose over the last two years and slightly outpaced the industry. On average, the company’s same-store sales have grown by 2.2% per year. Given its declining restaurant base over the same period, this performance stems from a mixture of higher prices and increased foot traffic at existing locations (closing restaurants can sometimes boost same-store sales).
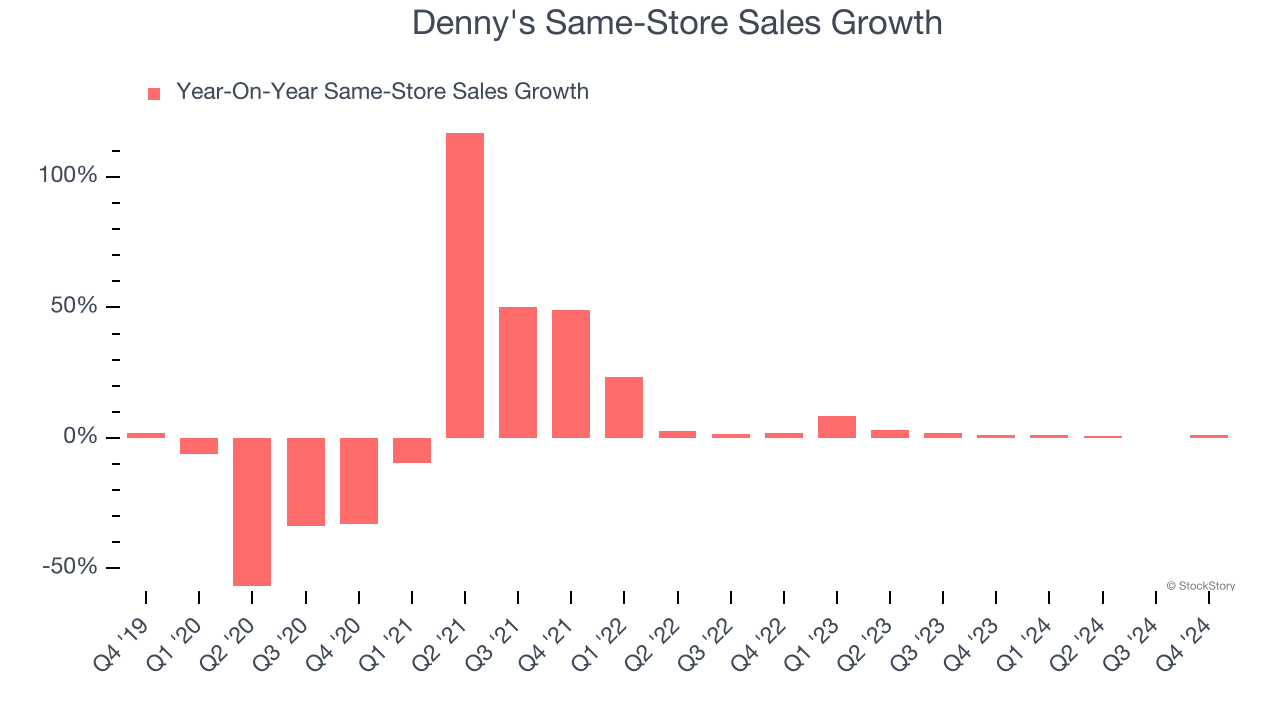
In the latest quarter, Denny’s same-store sales rose 1.1% year on year. This growth was a deceleration from its historical levels, showing the business is still performing well but losing a bit of steam.
Key Takeaways from Denny’s Q4 Results
We struggled to find many positives in these results as its revenue fell slightly short of Wall Street’s estimates. Its full-year EBITDA guidance also missed significantly. Overall, this quarter could have been better, but the stock traded up 1.5% to $6.82 immediately following the results.
Big picture, is Denny's a buy here and now? When making that decision, it’s important to consider its valuation, business qualities, as well as what has happened in the latest quarter. We cover that in our actionable full research report which you can read here, it’s free.