
Semiconductor machinery manufacturer Applied Materials (NASDAQ: AMAT) met Wall Street’s revenue expectations in Q4 CY2024, with sales up 6.8% year on year to $7.17 billion. On the other hand, next quarter’s revenue guidance of $7.1 billion was less impressive, coming in 0.8% below analysts’ estimates. Its non-GAAP profit of $2.38 per share was 3.7% above analysts’ consensus estimates.
Is now the time to buy Applied Materials? Find out by accessing our full research report, it’s free.
Applied Materials (AMAT) Q4 CY2024 Highlights:
- Revenue: $7.17 billion vs analyst estimates of $7.14 billion (6.8% year-on-year growth, in line)
- Adjusted EPS: $2.38 vs analyst estimates of $2.30 (3.7% beat)
- Adjusted Operating Income: $2.19 billion vs analyst estimates of $2.13 billion (30.6% margin, 2.9% beat)
- Revenue Guidance for Q1 CY2025 is $7.1 billion at the midpoint, below analyst estimates of $7.16 billion
- Adjusted EPS guidance for Q1 CY2025 is $2.30 at the midpoint, roughly in line with what analysts were expecting
- Operating Margin: 30.4%, up from 29.3% in the same quarter last year
- Free Cash Flow Margin: 7.6%, down from 31.3% in the same quarter last year
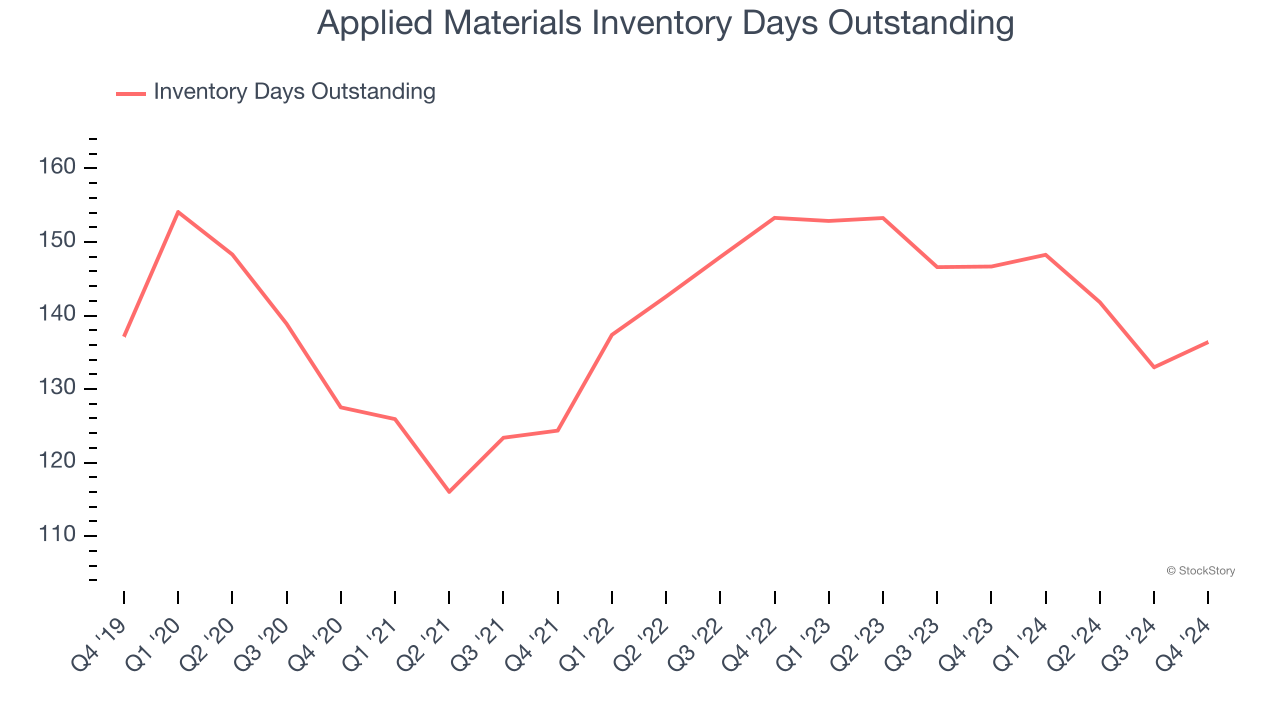
- Inventory Days Outstanding: 136, up from 133 in the previous quarter
- Market Capitalization: $147 billion
“The industry drive to accelerate the development of advanced compute and more sophisticated AI is gaining momentum,” said Gary Dickerson, President and CEO.
Company Overview
Founded in 1967 as the first company to develop tools for other businesses in the semiconductor industry, Applied Materials (NASDAQ: AMAT) is the largest provider of semiconductor wafer fabrication equipment.
Semiconductor Manufacturing
The semiconductor industry is driven by demand for advanced electronic products like smartphones, PCs, servers, and data storage. The need for technologies like artificial intelligence, 5G networks, and smart cars is also creating the next wave of growth for the industry. Keeping up with this dynamism requires new tools that can design, fabricate, and test chips at ever smaller sizes and more complex architectures, creating a dire need for semiconductor capital manufacturing equipment.
Sales Growth
Reviewing a company’s long-term sales performance reveals insights into its quality. Any business can have short-term success, but a top-tier one grows for years. Over the last five years, Applied Materials grew its sales at an impressive 13% compounded annual growth rate. Its growth surpassed the average semiconductor company and shows its offerings resonate with customers, a great starting point for our analysis. Semiconductors are a cyclical industry, and long-term investors should be prepared for periods of high growth followed by periods of revenue contractions (which can sometimes offer opportune times to buy).
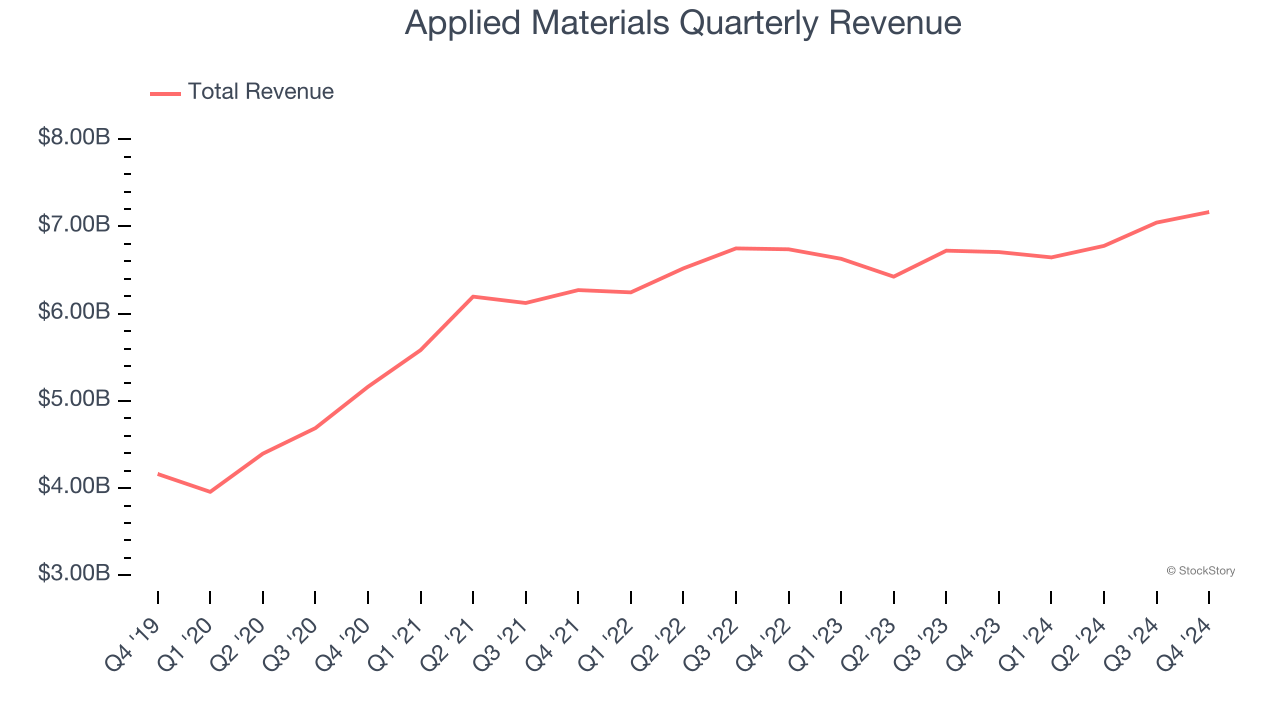
Long-term growth is the most important, but short-term results matter for semiconductors because the rapid pace of technological innovation (Moore's Law) could make yesterday's hit product obsolete today. Applied Materials’s recent history shows its demand slowed significantly as its annualized revenue growth of 2.6% over the last two years is well below its five-year trend. 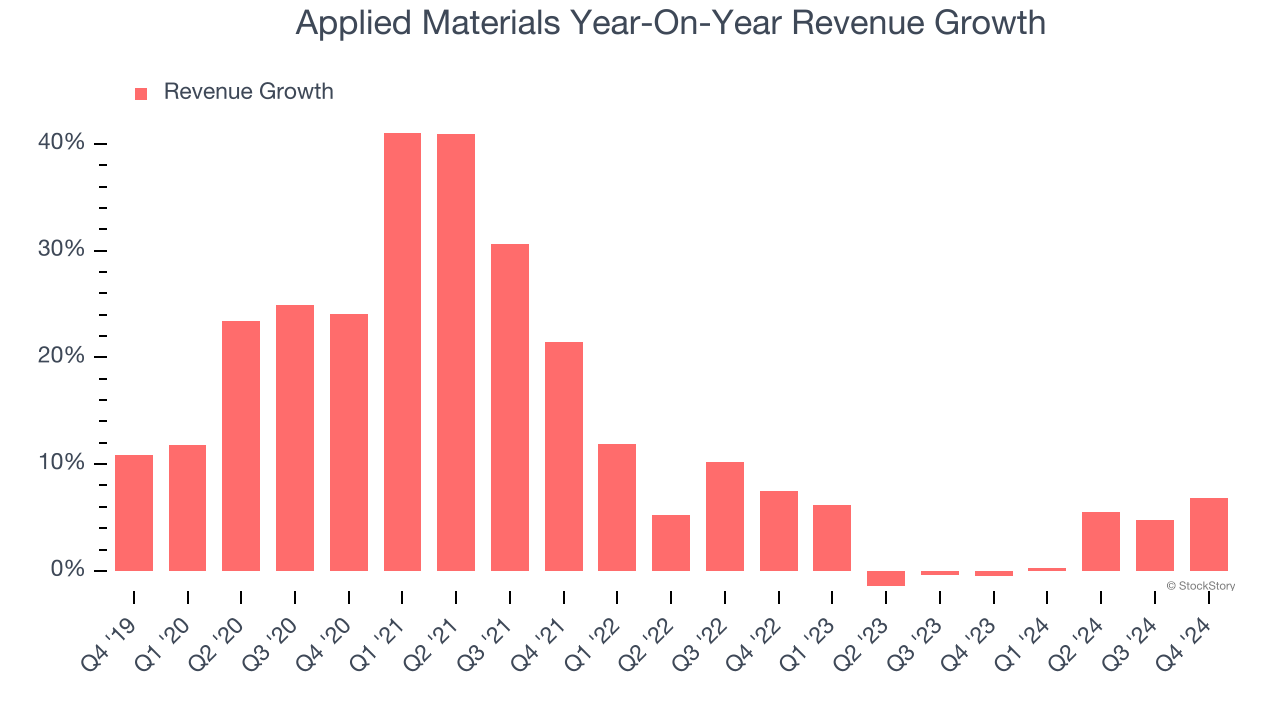
This quarter, Applied Materials grew its revenue by 6.8% year on year, and its $7.17 billion of revenue was in line with Wall Street’s estimates. Company management is currently guiding for a 6.8% year-on-year increase in sales next quarter.
Looking further ahead, sell-side analysts expect revenue to grow 5.9% over the next 12 months. Although this projection implies its newer products and services will spur better top-line performance, it is still below the sector average. At least the company is tracking well in other measures of financial health.
Today’s young investors won’t have read the timeless lessons in Gorilla Game: Picking Winners In High Technology because it was written more than 20 years ago when Microsoft and Apple were first establishing their supremacy. But if we apply the same principles, then enterprise software stocks leveraging their own generative AI capabilities may well be the Gorillas of the future. So, in that spirit, we are excited to present our Special Free Report on a profitable, fast-growing enterprise software stock that is already riding the automation wave and looking to catch the generative AI next.
Product Demand & Outstanding Inventory
Days Inventory Outstanding (DIO) is an important metric for chipmakers, as it reflects a business’ capital intensity and the cyclical nature of semiconductor supply and demand. In a tight supply environment, inventories tend to be stable, allowing chipmakers to exert pricing power. Steadily increasing DIO can be a warning sign that demand is weak, and if inventories continue to rise, the company may have to downsize production.
This quarter, Applied Materials’s DIO came in at 136, which is 4 days below its five-year average. These numbers show that despite the recent increase, there’s no indication of an excessive inventory buildup.
Key Takeaways from Applied Materials’s Q4 Results
It was encouraging to see Applied Materials beat analysts’ EPS expectations this quarter. We were also happy its adjusted operating income outperformed Wall Street’s estimates. On the other hand, its revenue guidance for next quarter slightly missed and its inventory levels slightly increased. Overall, this was a softer quarter. The stock traded down 4.4% to $176.21 immediately following the results.
Big picture, is Applied Materials a buy here and now? When making that decision, it’s important to consider its valuation, business qualities, as well as what has happened in the latest quarter. We cover that in our actionable full research report which you can read here, it’s free.


