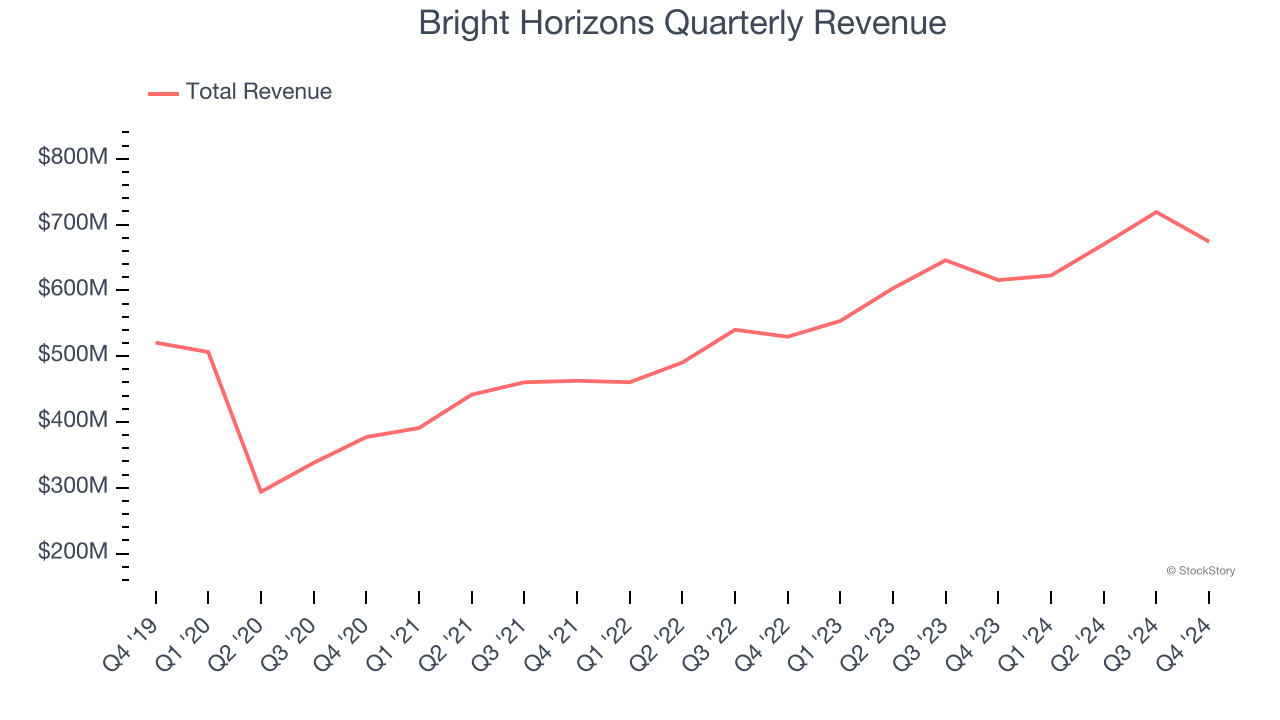
Child care and education company Bright Horizons (NYSE: BFAM) met Wall Street’s revenue expectations in Q4 CY2024, with sales up 9.5% year on year to $674.1 million. On the other hand, the company’s full-year revenue guidance of $2.88 billion at the midpoint came in 0.5% below analysts’ estimates. Its non-GAAP profit of $0.98 per share was 8% above analysts’ consensus estimates.
Is now the time to buy Bright Horizons? Find out by accessing our full research report, it’s free.
Bright Horizons (BFAM) Q4 CY2024 Highlights:
- Revenue: $674.1 million vs analyst estimates of $670.9 million (9.5% year-on-year growth, in line)
- Adjusted EPS: $0.98 vs analyst estimates of $0.91 (8% beat)
- Adjusted EBITDA: $110.7 million vs analyst estimates of $106.4 million (16.4% margin, 4% beat)
- Management’s revenue guidance for the upcoming financial year 2025 is $2.88 billion at the midpoint, missing analyst estimates by 0.5% and implying 7% growth (vs 11.1% in FY2024)
- Adjusted EPS guidance for the upcoming financial year 2025 is $4.05 at the midpoint, beating analyst estimates by 1.4%
- Operating Margin: 7.2%, up from 4.6% in the same quarter last year
- Free Cash Flow Margin: 13.4%, up from 10.5% in the same quarter last year
- Market Capitalization: $6.88 billion
Company Overview
Founded in 1986, Bright Horizons (NYSE: BFAM) is a global provider of child care, early education, and workforce support solutions.
Education Services
A whole industry has emerged to address the problem of rising education costs, offering consumers alternatives to traditional education paths such as four-year colleges. These alternative paths, which may include online courses or flexible schedules, make education more accessible to those with work or child-rearing obligations. However, some have run into issues around the value of the degrees and certifications they provide and whether customers are getting a good deal. Those who don’t prove their value could struggle to retain students, or even worse, invite the heavy hand of regulation.
Sales Growth
A company’s long-term sales performance can indicate its overall quality. Any business can put up a good quarter or two, but many enduring ones grow for years. Unfortunately, Bright Horizons’s 5.4% annualized revenue growth over the last five years was sluggish. This fell short of our benchmark for the consumer discretionary sector and is a tough starting point for our analysis.
Long-term growth is the most important, but within consumer discretionary, product cycles are short and revenue can be hit-driven due to rapidly changing trends and consumer preferences. Bright Horizons’s annualized revenue growth of 15.3% over the last two years is above its five-year trend, suggesting some bright spots. 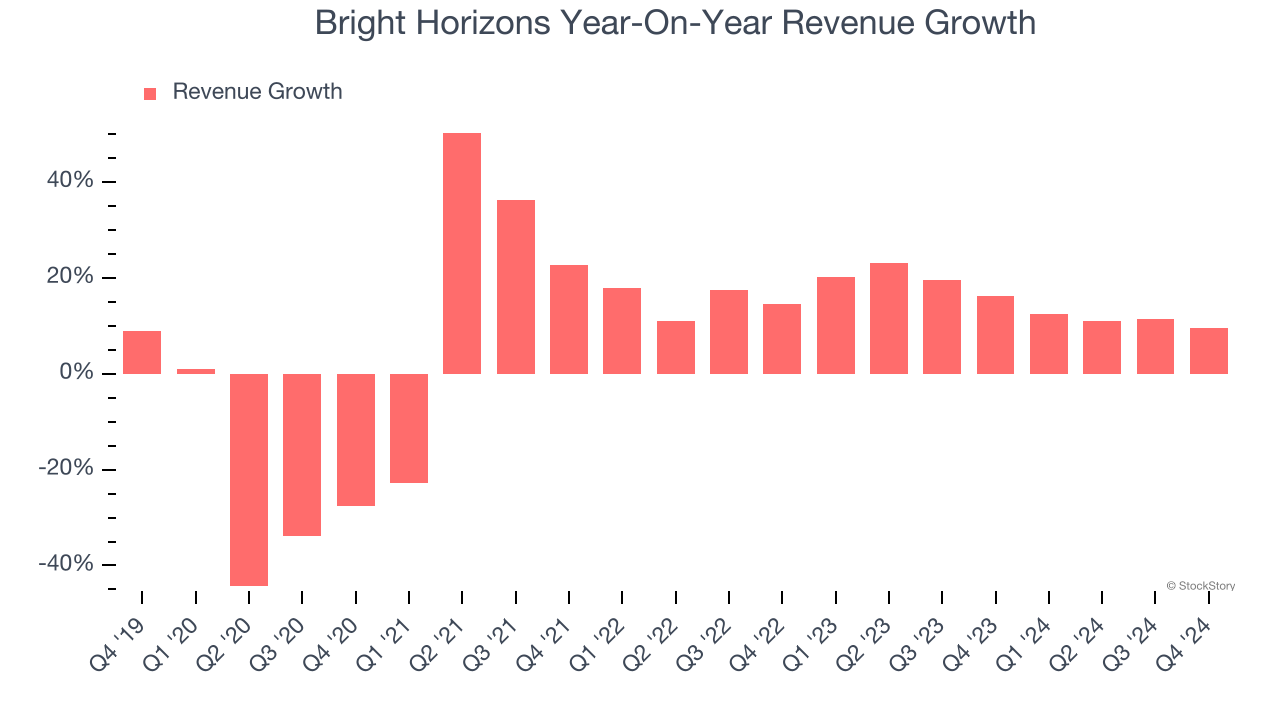
This quarter, Bright Horizons grew its revenue by 9.5% year on year, and its $674.1 million of revenue was in line with Wall Street’s estimates.
Looking ahead, sell-side analysts expect revenue to grow 7.5% over the next 12 months, a deceleration versus the last two years. This projection is underwhelming and implies its products and services will see some demand headwinds.
Unless you’ve been living under a rock, it should be obvious by now that generative AI is going to have a huge impact on how large corporations do business. While Nvidia and AMD are trading close to all-time highs, we prefer a lesser-known (but still profitable) stock benefiting from the rise of AI. Click here to access our free report one of our favorites growth stories.
Cash Is King
If you’ve followed StockStory for a while, you know we emphasize free cash flow. Why, you ask? We believe that in the end, cash is king, and you can’t use accounting profits to pay the bills.
Bright Horizons has shown weak cash profitability over the last two years, giving the company limited opportunities to return capital to shareholders. Its free cash flow margin averaged 8%, subpar for a consumer discretionary business.
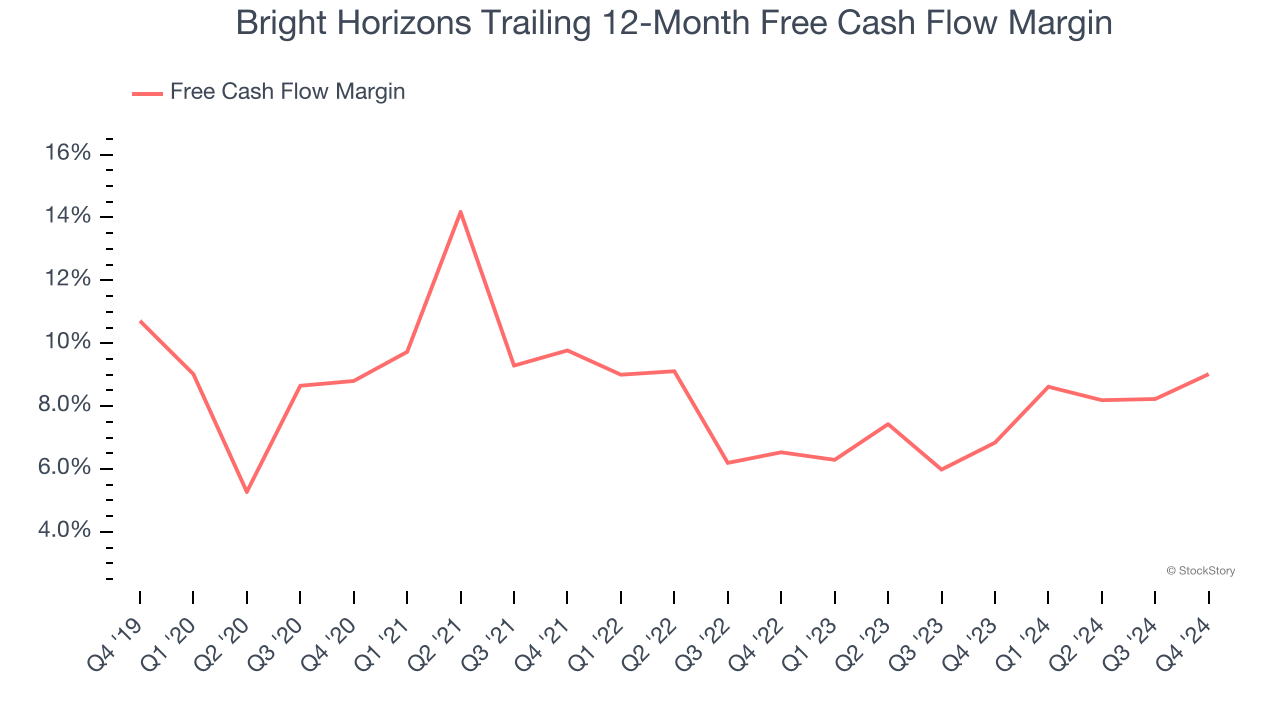
Bright Horizons’s free cash flow clocked in at $90.63 million in Q4, equivalent to a 13.4% margin. This result was good as its margin was 3 percentage points higher than in the same quarter last year, but we wouldn’t read too much into the short term because investment needs can be seasonal, leading to temporary swings. Long-term trends are more important.
Over the next year, analysts’ consensus estimates show they’re expecting Bright Horizons’s free cash flow margin of 9% for the last 12 months to remain the same.
Key Takeaways from Bright Horizons’s Q4 Results
It was encouraging to see Bright Horizons beat analysts’ EPS expectations this quarter. We were also happy its EBITDA outperformed Wall Street’s estimates. On the other hand, its full-year revenue guidance slightly missed. Zooming out, we think this was a decent quarter featuring some areas of strength but also some blemishes. The stock traded up 3.5% to $123 immediately following the results.
So should you invest in Bright Horizons right now? What happened in the latest quarter matters, but not as much as longer-term business quality and valuation, when deciding whether to invest in this stock. We cover that in our actionable full research report which you can read here, it’s free.