
Over the past six months, General Dynamics’s shares (currently trading at $247.98) have posted a disappointing 15.6% loss, well below the S&P 500’s 12.2% gain. This may have investors wondering how to approach the situation.
Is there a buying opportunity in General Dynamics, or does it present a risk to your portfolio? See what our analysts have to say in our full research report, it’s free.
Despite the more favorable entry price, we don't have much confidence in General Dynamics. Here are three reasons why we avoid GD and a stock we'd rather own.
Why Is General Dynamics Not Exciting?
Creator of the famous M1 Abrahms tank, General Dynamics (NYSE: GD) develops aerospace, marine systems, combat systems, and information technology products.
1. Weak Backlog Growth Points to Soft Demand
We can better understand Defense Contractors companies by analyzing their backlog. This metric shows the value of outstanding orders that have not yet been executed or delivered, giving visibility into General Dynamics’s future revenue streams.
General Dynamics’s backlog came in at $90.6 billion in the latest quarter, and over the last two years, its year-on-year growth averaged 1.9%. This performance was underwhelming and suggests that increasing competition is causing challenges in winning new orders. 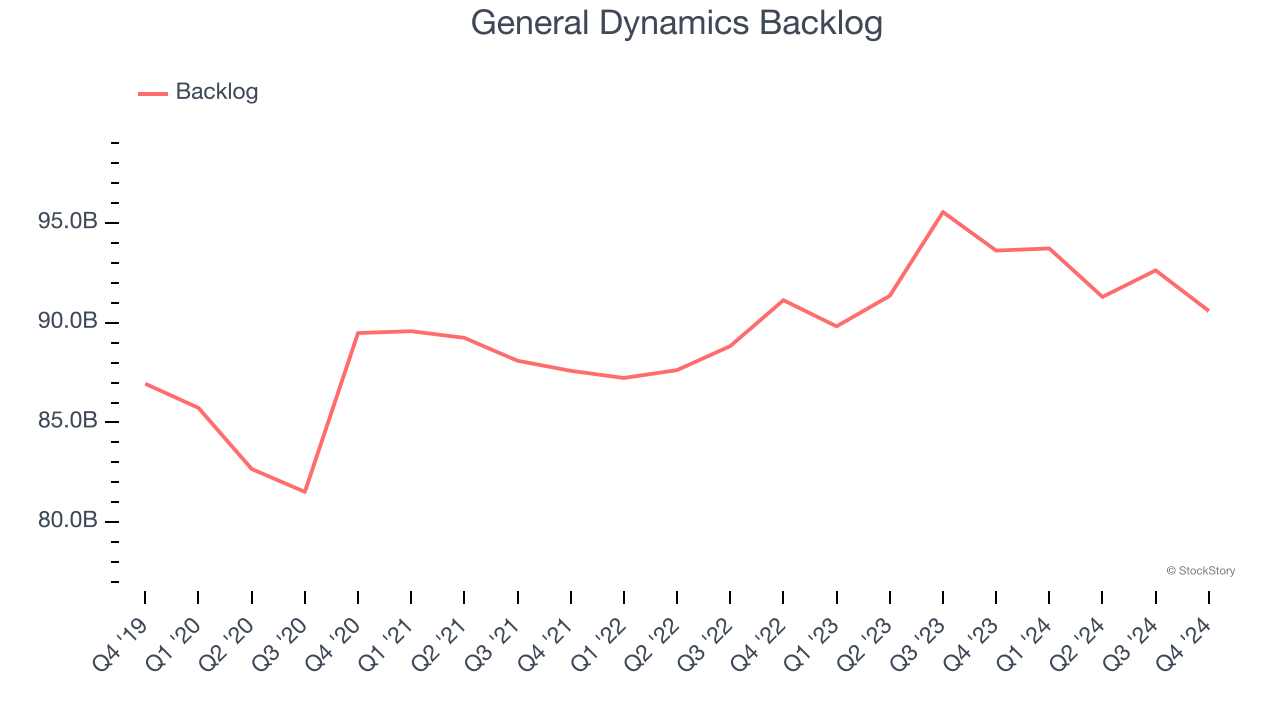
2. Projected Revenue Growth Is Slim
Forecasted revenues by Wall Street analysts signal a company’s potential. Predictions may not always be accurate, but accelerating growth typically boosts valuation multiples and stock prices while slowing growth does the opposite.
Over the next 12 months, sell-side analysts expect General Dynamics’s revenue to rise by 5.4%, a deceleration versus its 10% annualized growth for the past two years. This projection is underwhelming and implies its products and services will face some demand challenges.
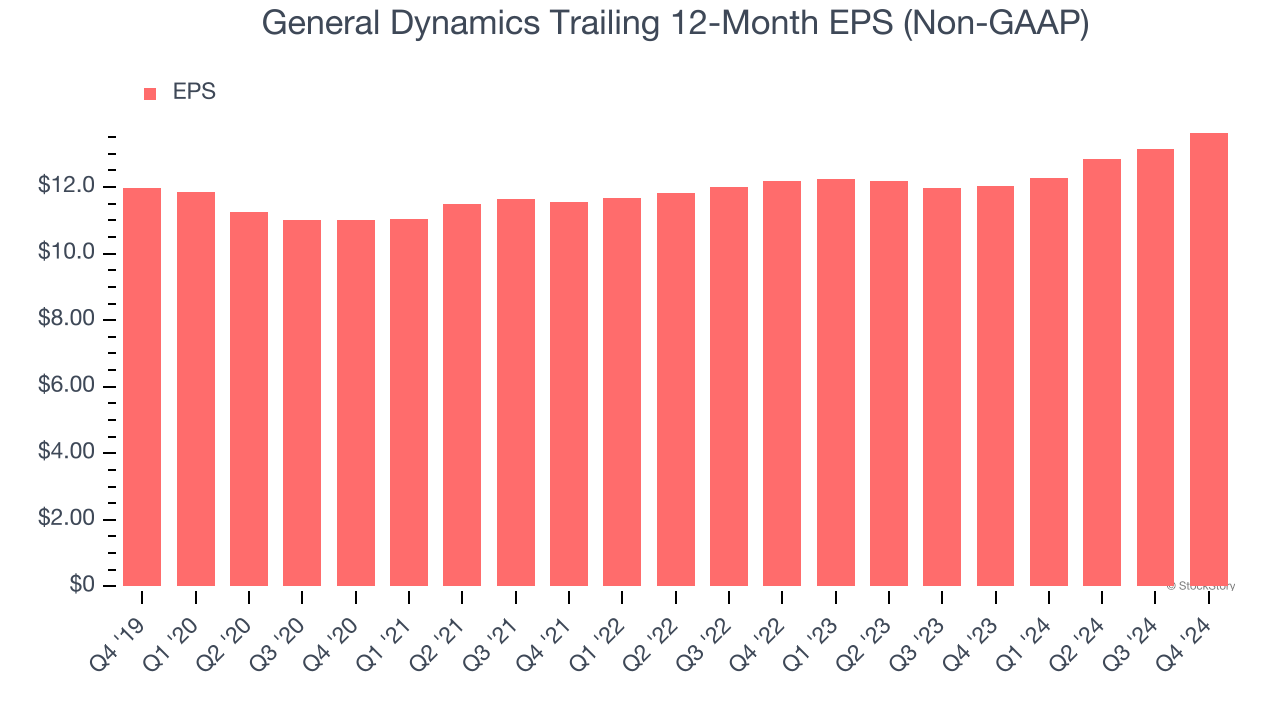
3. EPS Barely Growing
We track the long-term change in earnings per share (EPS) because it highlights whether a company’s growth is profitable.
General Dynamics’s EPS grew at a weak 2.6% compounded annual growth rate over the last five years, lower than its 3.9% annualized revenue growth. This tells us the company became less profitable on a per-share basis as it expanded.
Final Judgment
General Dynamics isn’t a terrible business, but it doesn’t pass our bar. Following the recent decline, the stock trades at 15.6× forward price-to-earnings (or $247.98 per share). Beauty is in the eye of the beholder, but we don’t really see a big opportunity at the moment. We're fairly confident there are better stocks to buy right now. We’d recommend looking at a safe-and-steady industrials business benefiting from an upgrade cycle.
Stocks We Would Buy Instead of General Dynamics
With rates dropping, inflation stabilizing, and the elections in the rearview mirror, all signs point to the start of a new bull run - and we’re laser-focused on finding the best stocks for this upcoming cycle.
Put yourself in the driver’s seat by checking out our Top 9 Market-Beating Stocks. This is a curated list of our High Quality stocks that have generated a market-beating return of 175% over the last five years.
Stocks that made our list in 2019 include now familiar names such as Nvidia (+2,183% between December 2019 and December 2024) as well as under-the-radar businesses like Sterling Infrastructure (+1,096% five-year return). Find your next big winner with StockStory today for free.