Construction equipment company Astec (NASDAQ: ASTE) fell short of the market’s revenue expectations in Q4 CY2024, but sales rose 6.5% year on year to $359 million. Its non-GAAP profit of $1.19 per share was 63% above analysts’ consensus estimates.
Is now the time to buy Astec? Find out by accessing our full research report, it’s free.
Astec (ASTE) Q4 CY2024 Highlights:
- Revenue: $359 million vs analyst estimates of $374.1 million (6.5% year-on-year growth, 4% miss)
- Adjusted EPS: $1.19 vs analyst estimates of $0.73 (63% beat)
- Adjusted EBITDA: $47.9 million vs analyst estimates of $27.6 million (13.3% margin, 73.6% beat)
- Operating Margin: 9.7%, in line with the same quarter last year
- Free Cash Flow Margin: 8.9%, down from 11.1% in the same quarter last year
- Market Capitalization: $710.7 million
Company Overview
Inventing the first ever double-barrel hot-mix asphalt plant, Astec (NASDAQ: ASTE) provides machines and equipment for building roads, processing raw materials, and producing concrete.
Construction Machinery
Automation that increases efficiencies and connected equipment that collects analyzable data have been trending, creating new sales opportunities for construction machinery companies. On the other hand, construction machinery companies are at the whim of economic cycles. Interest rates, for example, can greatly impact the commercial and residential construction that drives demand for these companies’ offerings.
Sales Growth
A company’s long-term sales performance is one signal of its overall quality. Even a bad business can shine for one or two quarters, but a top-tier one grows for years. Over the last five years, Astec grew its sales at a sluggish 2.2% compounded annual growth rate. This was below our standards and is a rough starting point for our analysis.
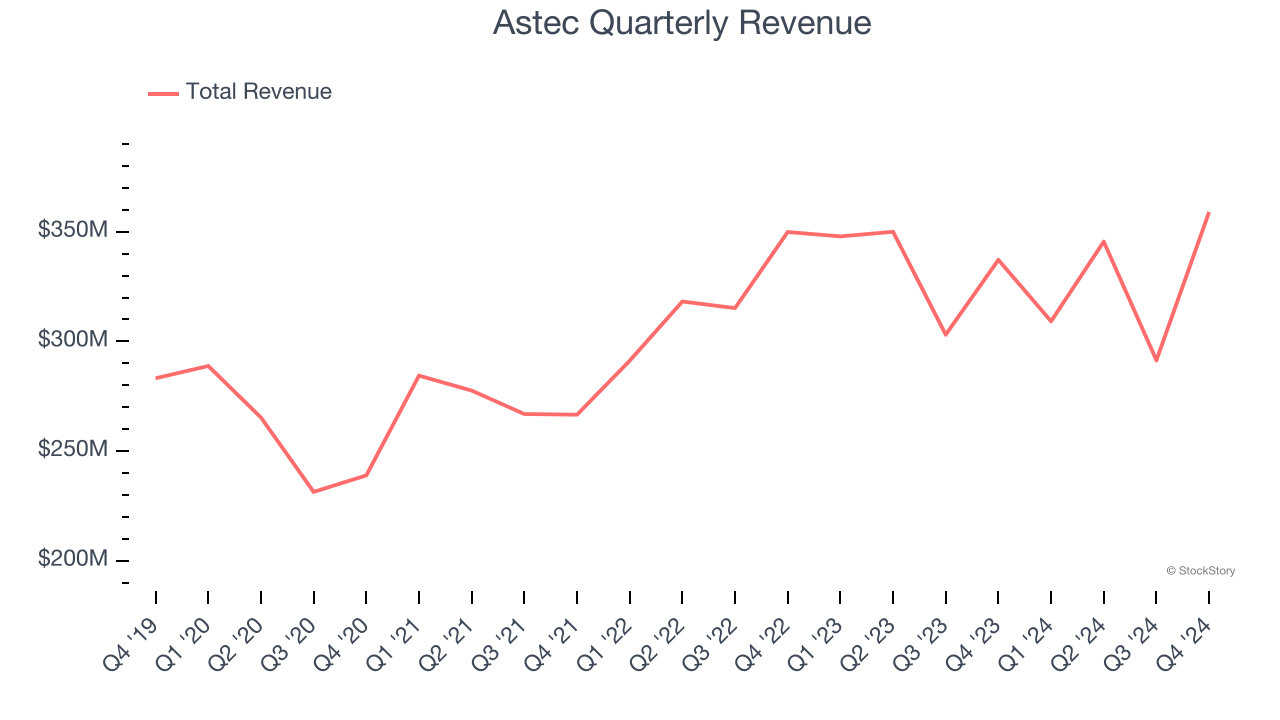
Long-term growth is the most important, but within industrials, a half-decade historical view may miss new industry trends or demand cycles. Astec’s recent history shows its demand slowed as its annualized revenue growth of 1.2% over the last two years is below its five-year trend. 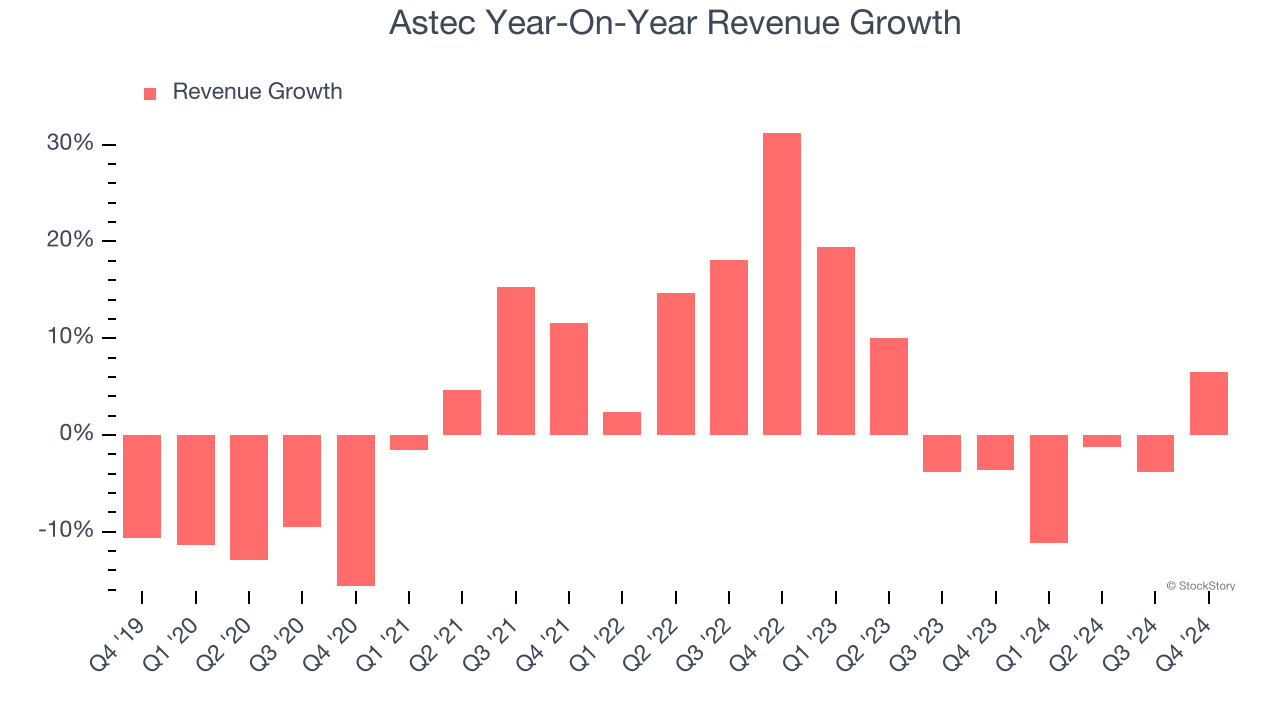
This quarter, Astec’s revenue grew by 6.5% year on year to $359 million, missing Wall Street’s estimates.
Looking ahead, sell-side analysts expect revenue to grow 3.5% over the next 12 months. While this projection indicates its newer products and services will fuel better top-line performance, it is still below the sector average.
Software is eating the world and there is virtually no industry left that has been untouched by it. That drives increasing demand for tools helping software developers do their jobs, whether it be monitoring critical cloud infrastructure, integrating audio and video functionality, or ensuring smooth content streaming. Click here to access a free report on our 3 favorite stocks to play this generational megatrend.
Operating Margin
Operating margin is an important measure of profitability as it shows the portion of revenue left after accounting for all core expenses – everything from the cost of goods sold to advertising and wages. It’s also useful for comparing profitability across companies with different levels of debt and tax rates because it excludes interest and taxes.
Astec was profitable over the last five years but held back by its large cost base. Its average operating margin of 4.6% was weak for an industrials business. This result isn’t too surprising given its low gross margin as a starting point.
Analyzing the trend in its profitability, Astec’s operating margin might fluctuated slightly but has generally stayed the same over the last five years. This raises an eyebrow about the company’s expense base because its revenue growth should have given it leverage on its fixed costs, resulting in better economies of scale and profitability.
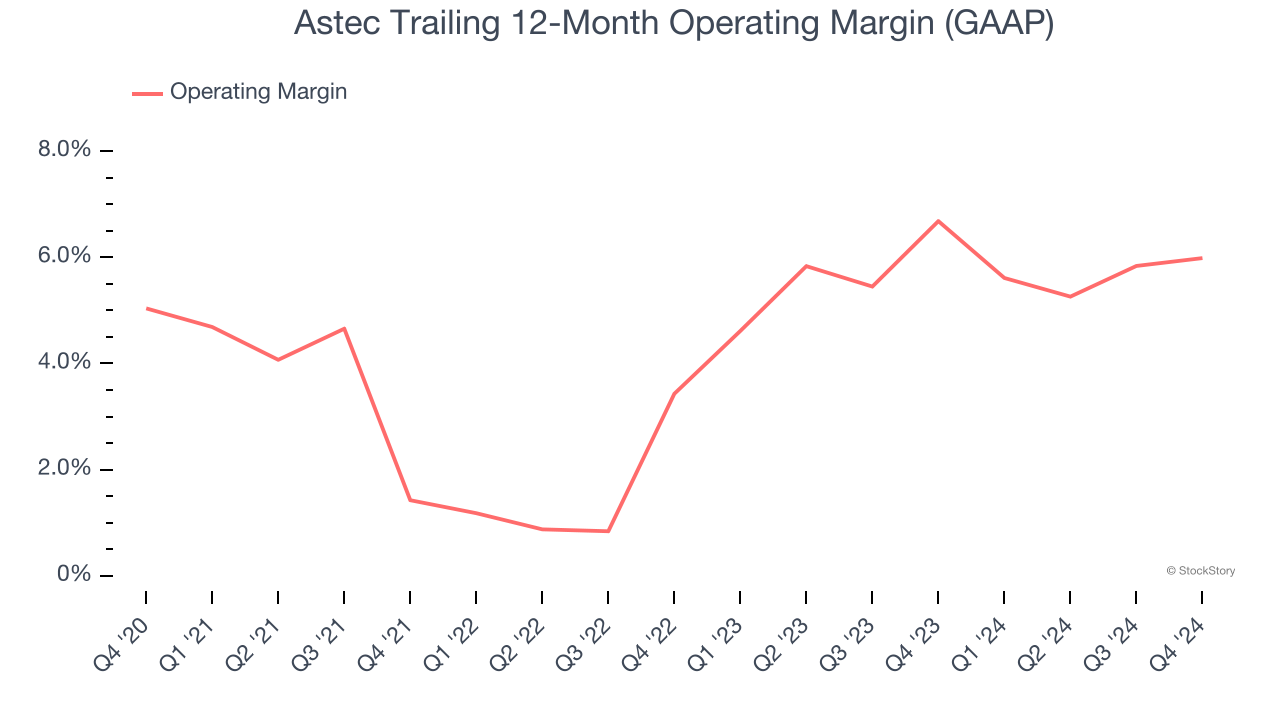
This quarter, Astec generated an operating profit margin of 9.7%, in line with the same quarter last year. This indicates the company’s cost structure has recently been stable.
Earnings Per Share
We track the long-term change in earnings per share (EPS) for the same reason as long-term revenue growth. Compared to revenue, however, EPS highlights whether a company’s growth is profitable.
Astec’s EPS grew at a decent 9.4% compounded annual growth rate over the last five years, higher than its 2.2% annualized revenue growth. However, we take this with a grain of salt because its operating margin didn’t expand and it didn’t repurchase its shares, meaning the delta came from reduced interest expenses or taxes.
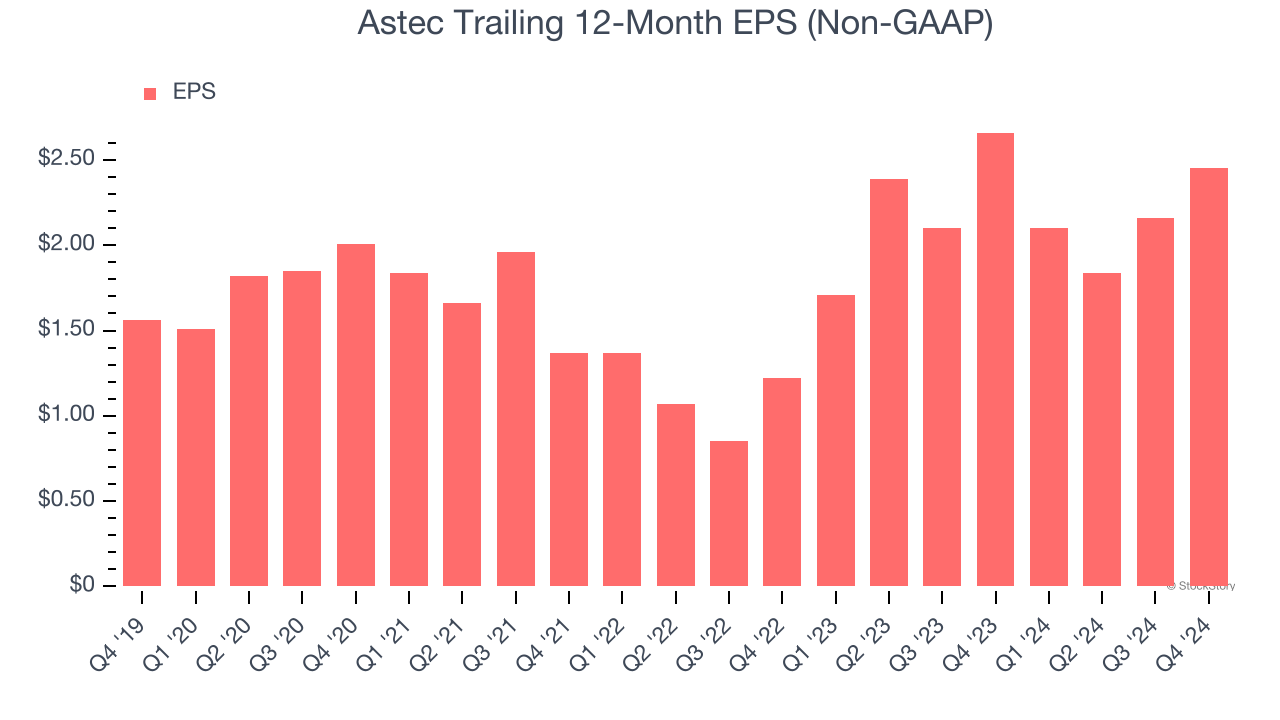
Like with revenue, we analyze EPS over a shorter period to see if we are missing a change in the business.
Astec’s two-year annual EPS growth of 41.7% was fantastic and topped its 1.2% two-year revenue growth.
In Q4, Astec reported EPS at $1.19, up from $0.90 in the same quarter last year. This print easily cleared analysts’ estimates, and shareholders should be content with the results. Over the next 12 months, Wall Street expects Astec’s full-year EPS of $2.45 to grow 3.7%.
Key Takeaways from Astec’s Q4 Results
We were impressed by how significantly Astec blew past analysts’ EPS and EBITDA expectations this quarter. On the other hand, its revenue missed significantly. Overall, we think this was a solid quarter with some key areas of upside. The stock traded up 5.7% to $32.99 immediately after reporting.
Sure, Astec had a solid quarter, but if we look at the bigger picture, is this stock a buy? If you’re making that decision, you should consider the bigger picture of valuation, business qualities, as well as the latest earnings. We cover that in our actionable full research report which you can read here, it’s free.