Over the past six months, Skechers’s shares (currently trading at $63.53) have posted a disappointing 9.2% loss, well below the S&P 500’s 6.4% gain. This was partly driven by its softer quarterly results and may have investors wondering how to approach the situation.
Is now the time to buy Skechers, or should you be careful about including it in your portfolio? See what our analysts have to say in our full research report, it’s free.
Even with the cheaper entry price, we don't have much confidence in Skechers. Here are three reasons why we avoid SKX and a stock we'd rather own.
Why Is Skechers Not Exciting?
Synonymous with "dad shoe", Skechers (NYSE: SKX) is a footwear company renowned for its comfortable, stylish, and affordable shoes for all ages.
1. Weak Constant Currency Growth Points to Soft Demand
We can better understand Footwear companies by analyzing their constant currency revenue. This metric excludes currency movements, which are outside of Skechers’s control and are not indicative of underlying demand.
Over the last two years, Skechers’s constant currency revenue averaged 10.1% year-on-year growth. This performance was underwhelming and suggests it might have to lower prices or invest in product improvements to accelerate growth, factors that can hinder near-term profitability. 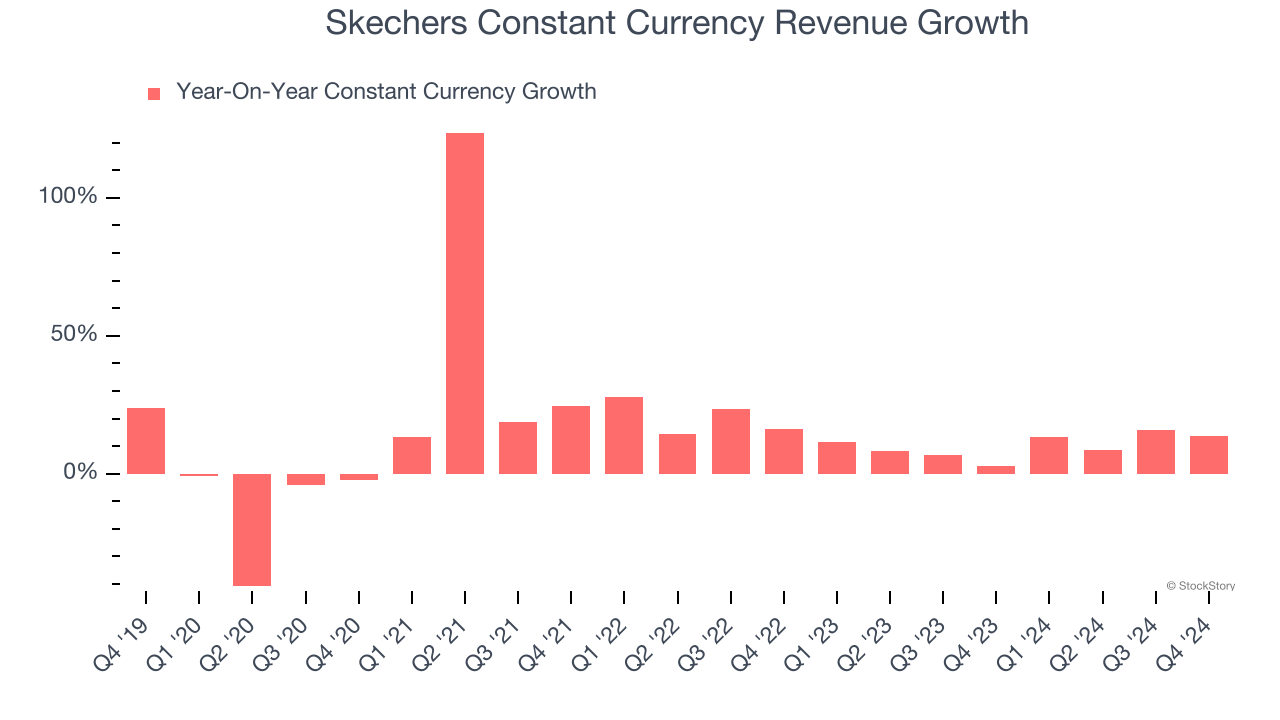
2. Projected Revenue Growth Is Slim
Forecasted revenues by Wall Street analysts signal a company’s potential. Predictions may not always be accurate, but accelerating growth typically boosts valuation multiples and stock prices while slowing growth does the opposite.
Over the next 12 months, sell-side analysts expect Skechers’s revenue to rise by 8.8%, close to its 9.8% annualized growth for the past two years. This projection is underwhelming and implies its newer products and services will not lead to better top-line performance yet.
3. Mediocre Free Cash Flow Margin Limits Reinvestment Potential
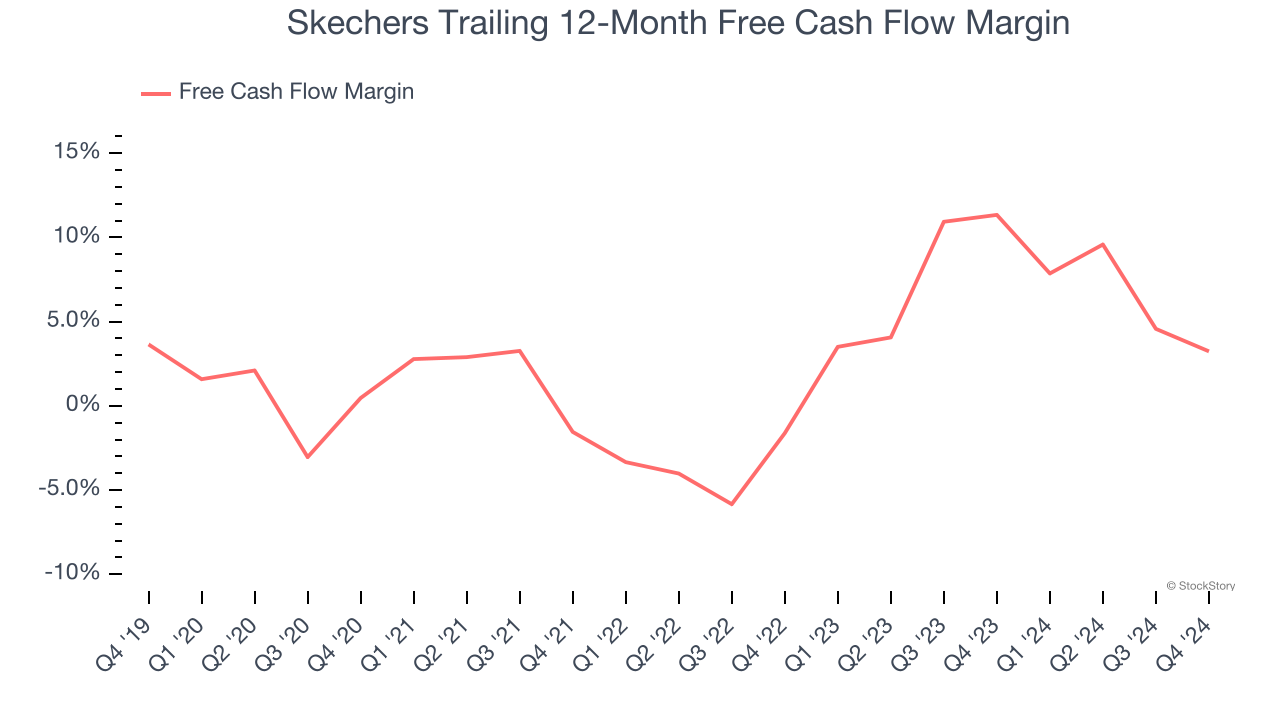
If you’ve followed StockStory for a while, you know we emphasize free cash flow. Why, you ask? We believe that in the end, cash is king, and you can’t use accounting profits to pay the bills.
Skechers has shown weak cash profitability over the last two years, giving the company limited opportunities to return capital to shareholders. Its free cash flow margin averaged 7.1%, subpar for a consumer discretionary business.
Final Judgment
Skechers isn’t a terrible business, but it doesn’t pass our bar. Following the recent decline, the stock trades at 13× forward price-to-earnings (or $63.53 per share). While this valuation is fair, the upside isn’t great compared to the potential downside. We're pretty confident there are superior stocks to buy right now. Let us point you toward an all-weather company that owns household favorite Taco Bell.
Stocks We Like More Than Skechers
The elections are now behind us. With rates dropping and inflation cooling, many analysts expect a breakout market - and we’re zeroing in on the stocks that could benefit immensely.
Take advantage of the rebound by checking out our Top 5 Growth Stocks for this month. This is a curated list of our High Quality stocks that have generated a market-beating return of 175% over the last five years.
Stocks that made our list in 2019 include now familiar names such as Nvidia (+2,183% between December 2019 and December 2024) as well as under-the-radar businesses like Comfort Systems (+751% five-year return). Find your next big winner with StockStory today for free.