Local broadcasting and digital media company Nexstar (NASDAQ: NXST) reported Q4 CY2024 results exceeding the market’s revenue expectations, with sales up 14.1% year on year to $1.49 billion. Its GAAP profit of $7.56 per share was 6.2% below analysts’ consensus estimates.
Is now the time to buy Nexstar Media? Find out by accessing our full research report, it’s free.
Nexstar Media (NXST) Q4 CY2024 Highlights:
- Revenue: $1.49 billion vs analyst estimates of $1.48 billion (14.1% year-on-year growth, 0.5% beat)
- EPS (GAAP): $7.56 vs analyst expectations of $8.06 (6.2% miss)
- Adjusted EBITDA: $628 million vs analyst estimates of $578.7 million (42.2% margin, 8.5% beat)
- Operating Margin: 28%, up from 17.6% in the same quarter last year
- Free Cash Flow Margin: 25.3%, up from 19.3% in the same quarter last year
- Market Capitalization: $4.54 billion
IRVING, Texas--(BUSINESS WIRE)--Nexstar Media Group, Inc. (NASDAQ: NXST) (“Nexstar” or the “Company”) today reported financial results for the fourth quarter and full year ended December 31, 2024 as summarized below.
Company Overview
Founded in 1996, Nexstar (NASDAQ: NXST) is an American media company operating numerous local television stations and digital media outlets across the country.
Broadcasting
Broadcasting companies have been facing secular headwinds in the form of consumers abandoning traditional television and radio in favor of streaming services. As a result, many broadcasting companies have evolved by forming distribution agreements with major streaming platforms so they can get in on part of the action, but will these subscription revenues be as high quality and high margin as their legacy revenues? Only time will tell which of these broadcasters will survive the sea changes of technological advancement and fragmenting consumer attention.
Sales Growth
A company’s long-term performance is an indicator of its overall quality. While any business can experience short-term success, top-performing ones enjoy sustained growth for years. Over the last five years, Nexstar Media grew its sales at a 12.2% compounded annual growth rate. Although this growth is acceptable on an absolute basis, it fell short of our standards for the consumer discretionary sector, which enjoys a number of secular tailwinds.
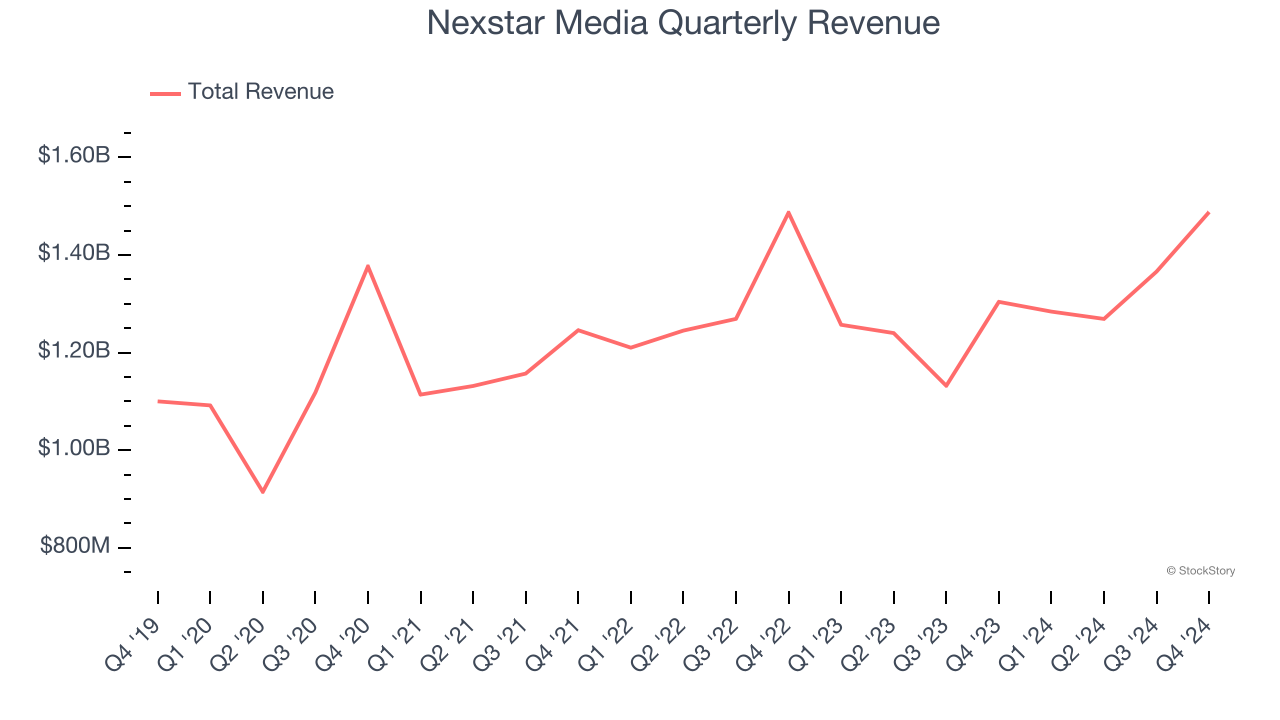
We at StockStory place the most emphasis on long-term growth, but within consumer discretionary, a stretched historical view may miss a company riding a successful new product or trend. Nexstar Media’s recent history shows its demand slowed as its annualized revenue growth of 1.9% over the last two years is below its five-year trend. 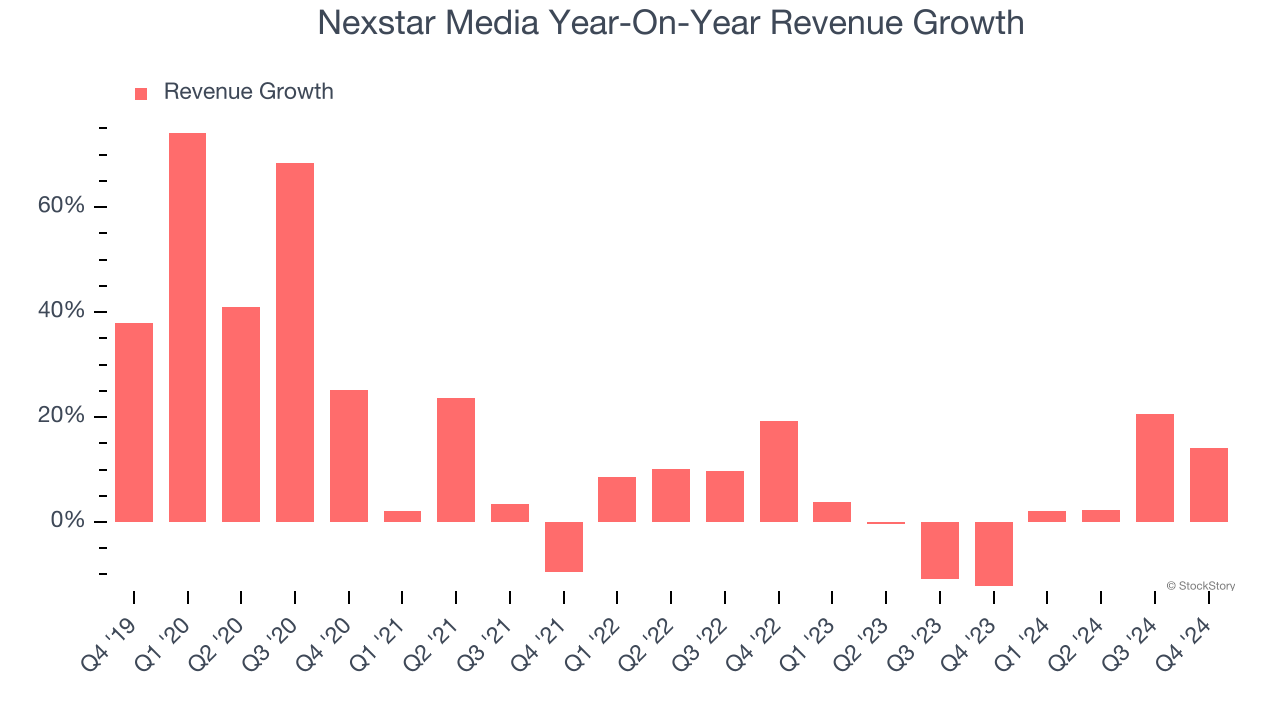
Nexstar Media also breaks out the revenue for its most important segments, Distribution and Core Advertising, which are 48% and 50.9% of revenue. Over the last two years, Nexstar Media’s Distribution revenue (licensing and affiliate fees) averaged 7% year-on-year growth while its Core Advertising revenue (TV and radio ads) averaged 2% growth.
This quarter, Nexstar Media reported year-on-year revenue growth of 14.1%, and its $1.49 billion of revenue exceeded Wall Street’s estimates by 0.5%.
Looking ahead, sell-side analysts expect revenue to decline by 7.2% over the next 12 months, a deceleration versus the last two years. This projection is underwhelming and implies its products and services will see some demand headwinds.
Unless you’ve been living under a rock, it should be obvious by now that generative AI is going to have a huge impact on how large corporations do business. While Nvidia and AMD are trading close to all-time highs, we prefer a lesser-known (but still profitable) stock benefiting from the rise of AI. Click here to access our free report one of our favorites growth stories.
Cash Is King
Free cash flow isn't a prominently featured metric in company financials and earnings releases, but we think it's telling because it accounts for all operating and capital expenses, making it tough to manipulate. Cash is king.
Nexstar Media has shown robust cash profitability, giving it an edge over its competitors and the ability to reinvest or return capital to investors. The company’s free cash flow margin averaged 19.2% over the last two years, quite impressive for a consumer discretionary business.
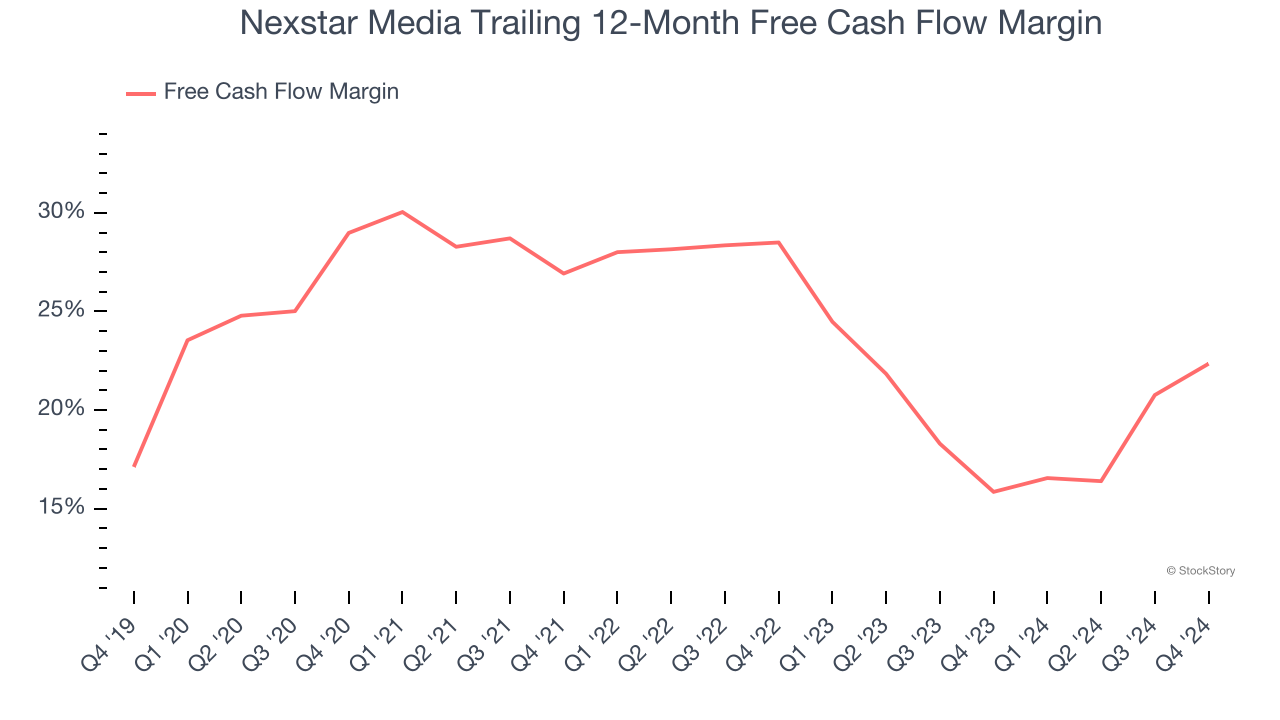
Nexstar Media’s free cash flow clocked in at $376 million in Q4, equivalent to a 25.3% margin. This result was good as its margin was 5.9 percentage points higher than in the same quarter last year, but we wouldn’t read too much into the short term because investment needs can be seasonal, leading to temporary swings. Long-term trends are more important.
Over the next year, analysts predict Nexstar Media’s cash conversion will fall. Their consensus estimates imply its free cash flow margin of 22.3% for the last 12 months will decrease to 17%.
Key Takeaways from Nexstar Media’s Q4 Results
It was good to see Nexstar Media beat analysts’ Core Advertising revenue expectations this quarter. We were also happy its EBITDA outperformed Wall Street’s estimates. On the other hand, its EPS missed. Overall, this quarter could have been better. The stock traded up 2.2% to $149.50 immediately following the results.
Is Nexstar Media an attractive investment opportunity at the current price? What happened in the latest quarter matters, but not as much as longer-term business quality and valuation, when deciding whether to invest in this stock. We cover that in our actionable full research report which you can read here, it’s free.