
Global entertainment and media company Warner Bros. Discovery (NASDAQ: WBD) missed Wall Street’s revenue expectations in Q4 CY2024, with sales falling 2.5% year on year to $10.03 billion. Its GAAP loss of $0.20 per share was significantly below analysts’ consensus estimates.
Is now the time to buy Warner Bros. Discovery? Find out by accessing our full research report, it’s free.
Warner Bros. Discovery (WBD) Q4 CY2024 Highlights:
- Revenue: $10.03 billion vs analyst estimates of $10.22 billion (2.5% year-on-year decline, 1.9% miss)
- EPS (GAAP): -$0.20 vs analyst estimates of $0.03 (significant miss)
- Adjusted EBITDA: $2.72 billion vs analyst estimates of $2.66 billion (27.1% margin, 2.3% beat)
- Added 6.4 million Max subscribers, forecasts 150 million subs by end of 2026
- Operating Margin: 1.6%, up from -1.8% in the same quarter last year
- Free Cash Flow Margin: 24.2%, down from 32.2% in the same quarter last year
- Market Capitalization: $25.76 billion
Company Overview
Formed from the merger of WarnerMedia and Discovery, Warner Bros. Discovery (NASDAQ: WBD) is a multinational media and entertainment company, offering television networks, streaming services, and film and television production.
Media
The advent of the internet changed how shows, films, music, and overall information flow. As a result, many media companies now face secular headwinds as attention shifts online. Some have made concerted efforts to adapt by introducing digital subscriptions, podcasts, and streaming platforms. Time will tell if their strategies succeed and which companies will emerge as the long-term winners.
Sales Growth
A company’s long-term sales performance can indicate its overall quality. Any business can put up a good quarter or two, but many enduring ones grow for years. Luckily, Warner Bros. Discovery’s sales grew at an exceptional 28.7% compounded annual growth rate over the last five years. Its growth beat the average consumer discretionary company and shows its offerings resonate with customers.
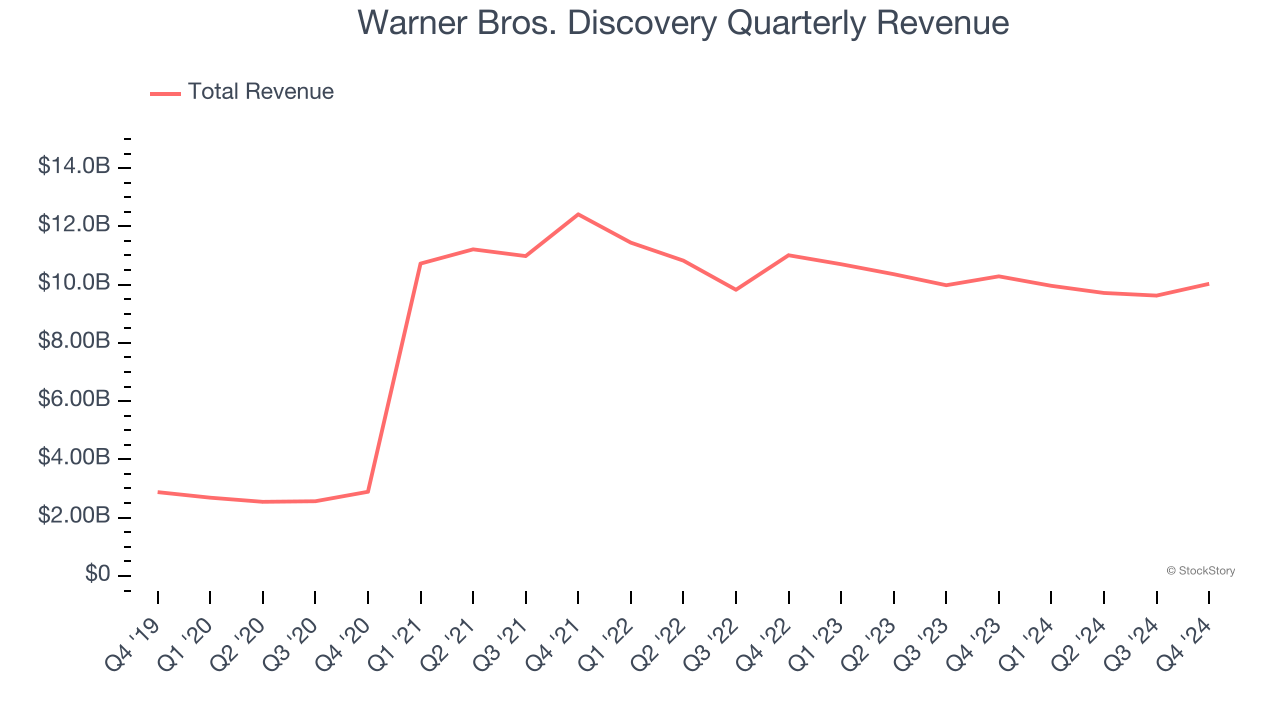
Long-term growth is the most important, but within consumer discretionary, product cycles are short and revenue can be hit-driven due to rapidly changing trends and consumer preferences. Warner Bros. Discovery’s recent history marks a sharp pivot from its five-year trend as its revenue has shown annualized declines of 4.5% over the last two years. 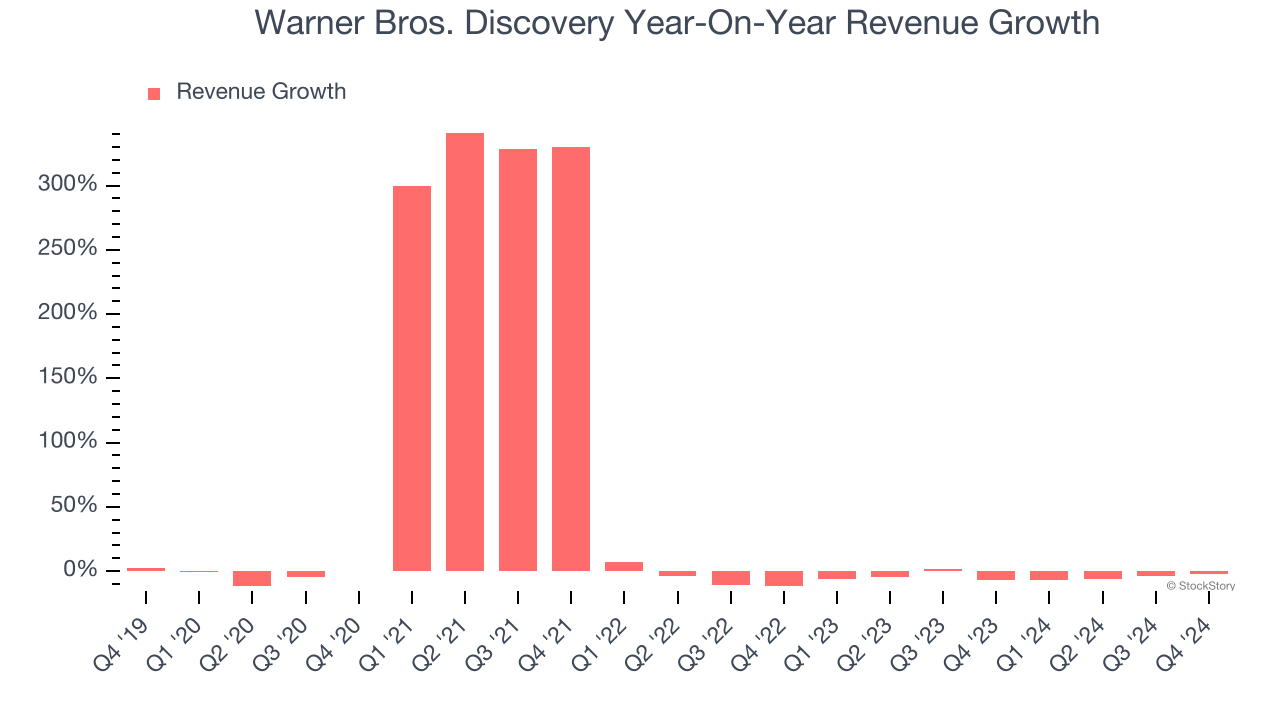
Warner Bros. Discovery also breaks out the revenue for its three most important segments: Distribution, Advertising, and Content, which are 49%, 18.3%, and 29% of revenue. Over the last two years, Warner Bros. Discovery’s revenues in all three segments declined. Its Distribution revenue (licensing fees) averaged year-on-year decreases of 1.9% while its Advertising (marketing services) and Content (films, streaming, games) revenues averaged drops of 9.7% and 5.5%.
This quarter, Warner Bros. Discovery missed Wall Street’s estimates and reported a rather uninspiring 2.5% year-on-year revenue decline, generating $10.03 billion of revenue.
Looking ahead, sell-side analysts expect revenue to grow 1% over the next 12 months. Although this projection implies its newer products and services will catalyze better top-line performance, it is still below the sector average.
Unless you’ve been living under a rock, it should be obvious by now that generative AI is going to have a huge impact on how large corporations do business. While Nvidia and AMD are trading close to all-time highs, we prefer a lesser-known (but still profitable) stock benefiting from the rise of AI. Click here to access our free report one of our favorites growth stories.
Cash Is King
If you’ve followed StockStory for a while, you know we emphasize free cash flow. Why, you ask? We believe that in the end, cash is king, and you can’t use accounting profits to pay the bills.
Warner Bros. Discovery has shown impressive cash profitability, giving it the option to reinvest or return capital to investors. The company’s free cash flow margin averaged 13.1% over the last two years, better than the broader consumer discretionary sector. The divergence from its underwhelming operating margin stems from the add-back of non-cash charges like depreciation and stock-based compensation. GAAP operating profit expenses these line items, but free cash flow does not.
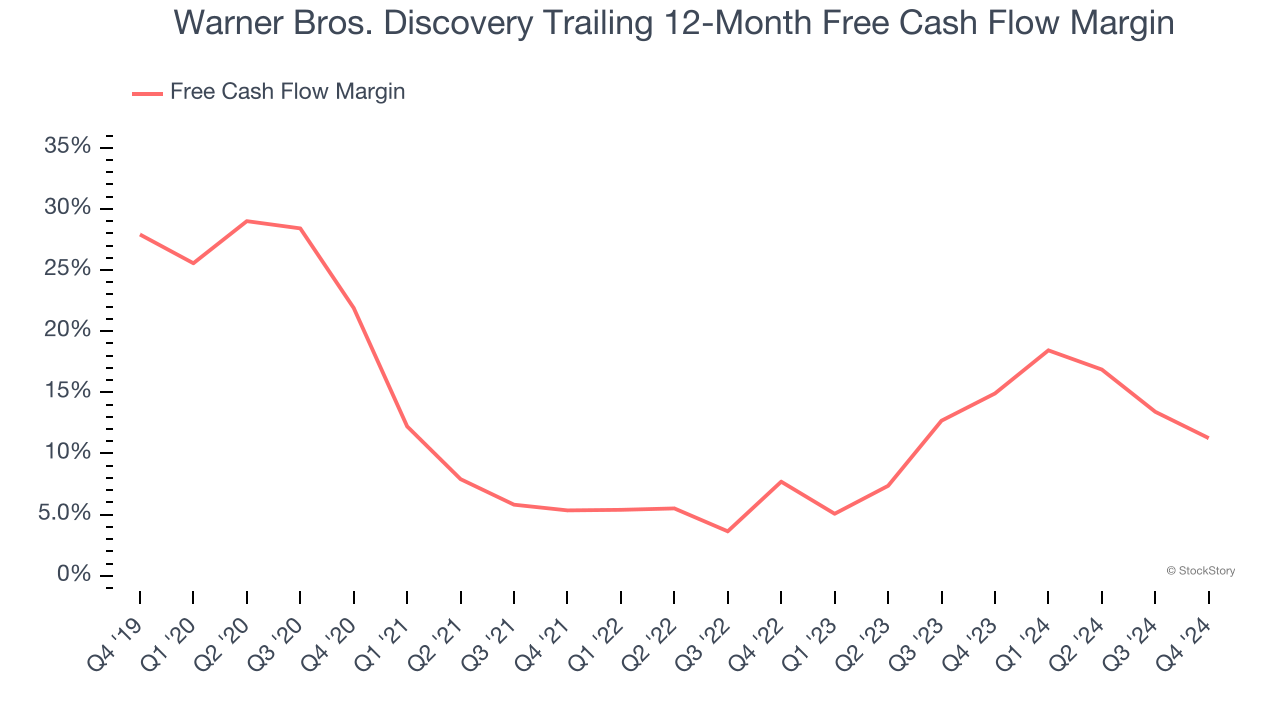
Warner Bros. Discovery’s free cash flow clocked in at $2.43 billion in Q4, equivalent to a 24.2% margin. The company’s cash profitability regressed as it was 8 percentage points lower than in the same quarter last year, but it’s still above its two-year average. We wouldn’t read too much into this quarter’s decline because investment needs can be seasonal, causing short-term swings. Long-term trends trump temporary fluctuations.
Over the next year, analysts’ consensus estimates show they’re expecting Warner Bros. Discovery’s free cash flow margin of 11.3% for the last 12 months to remain the same.
Key Takeaways from Warner Bros. Discovery’s Q4 Results
It was good to see WBD beat analysts' EBITDA estimates this quarter and add more Max subscribers than expected. On the other hand, its revenue and EPS missed. Overall, this was a mixed quarter. The stock traded up 5.1% to $11.03 immediately following the results.
Is Warner Bros. Discovery an attractive investment opportunity at the current price? We think that the latest quarter is only one piece of the longer-term business quality puzzle. Quality, when combined with valuation, can help determine if the stock is a buy. We cover that in our actionable full research report which you can read here, it’s free.


