AbbVie trades at $205.51 per share and has stayed right on track with the overall market, gaining 5.2% over the last six months. At the same time, the S&P 500 has returned 5.1%.
Is there a buying opportunity in AbbVie, or does it present a risk to your portfolio? Get the full stock story straight from our expert analysts, it’s free.
We don't have much confidence in AbbVie. Here are three reasons why we avoid ABBV and a stock we'd rather own.
Why Is AbbVie Not Exciting?
Founded in 2013 as a spin-off from Abbott Laboratories (NYSE: ABT), AbbVie (NYSE: ABBV) is a biopharmaceutical company that develops and sells prescription medicines focused on areas like immunology (arthritis, for example), oncology (cancers), and neuroscience (depression, for example).
1. Constant Currency Revenue Hits a Standstill
We can better understand Therapeutics companies by analyzing their constant currency revenue. This metric excludes currency movements, which are outside of AbbVie’s control and are not indicative of underlying demand.
Over the last two years, AbbVie failed to grow its constant currency revenue. This performance was underwhelming and implies there may be increasing competition or market saturation. It also suggests AbbVie might have to lower prices or invest in product improvements to accelerate growth, factors that can hinder near-term profitability. 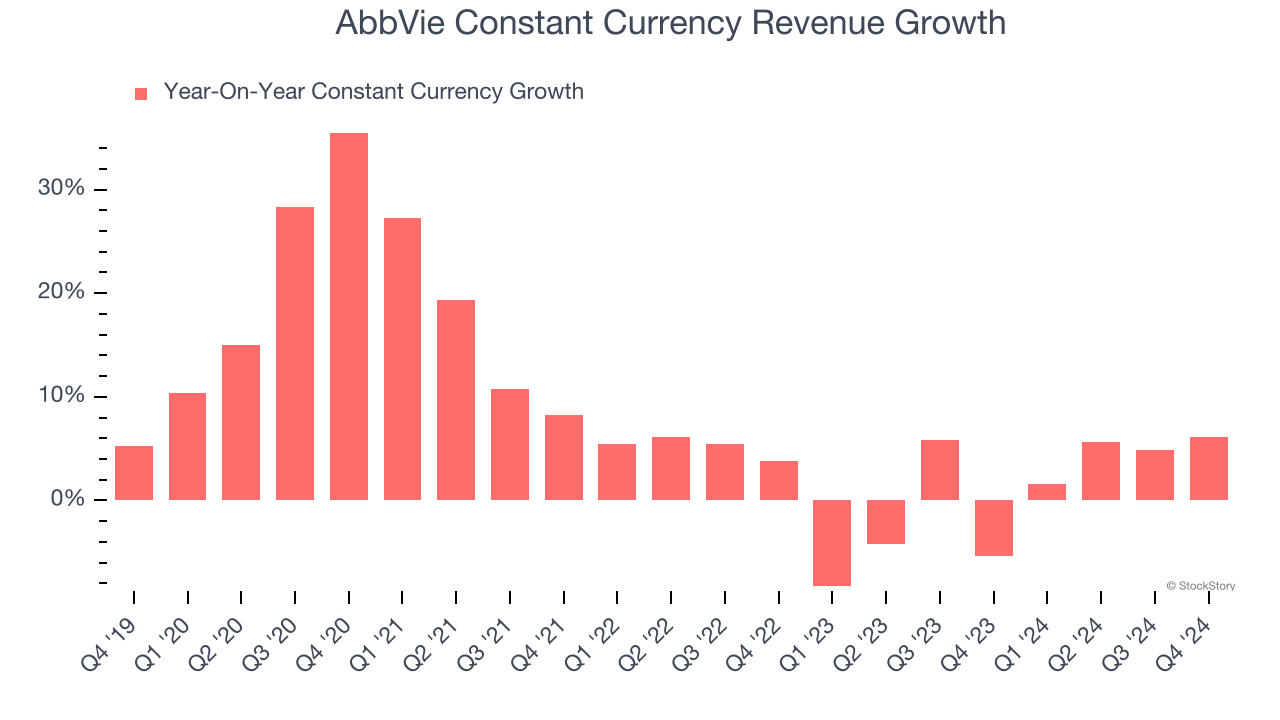
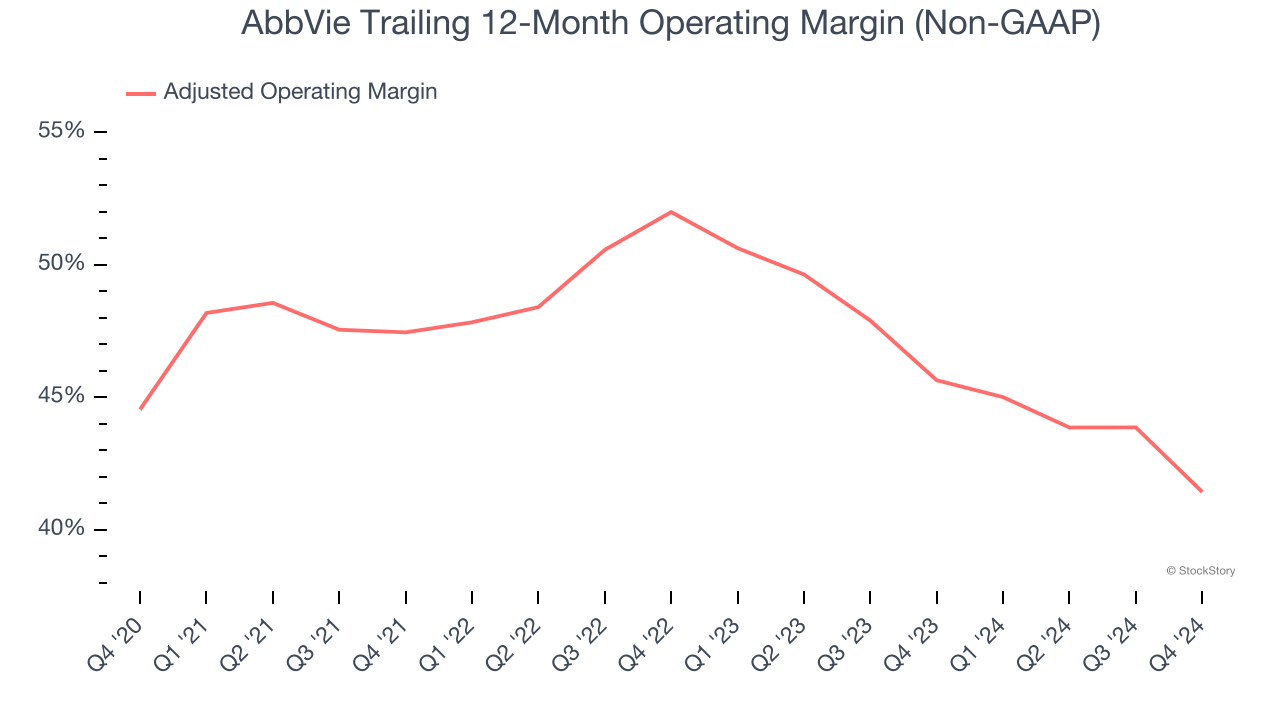
2. Shrinking Adjusted Operating Margin
Adjusted operating margin is a key measure of profitability. Think of it as net income (the bottom line) excluding the impact of non-recurring expenses, taxes, and interest on debt - metrics less connected to business fundamentals.
Looking at the trend in its profitability, AbbVie’s adjusted operating margin decreased by 10.6 percentage points over the last two years. This raises an eyebrow about the company’s expense base because its revenue growth should have given it leverage on its fixed costs, resulting in better economies of scale and profitability. Its adjusted operating margin for the trailing 12 months was 41.4%.
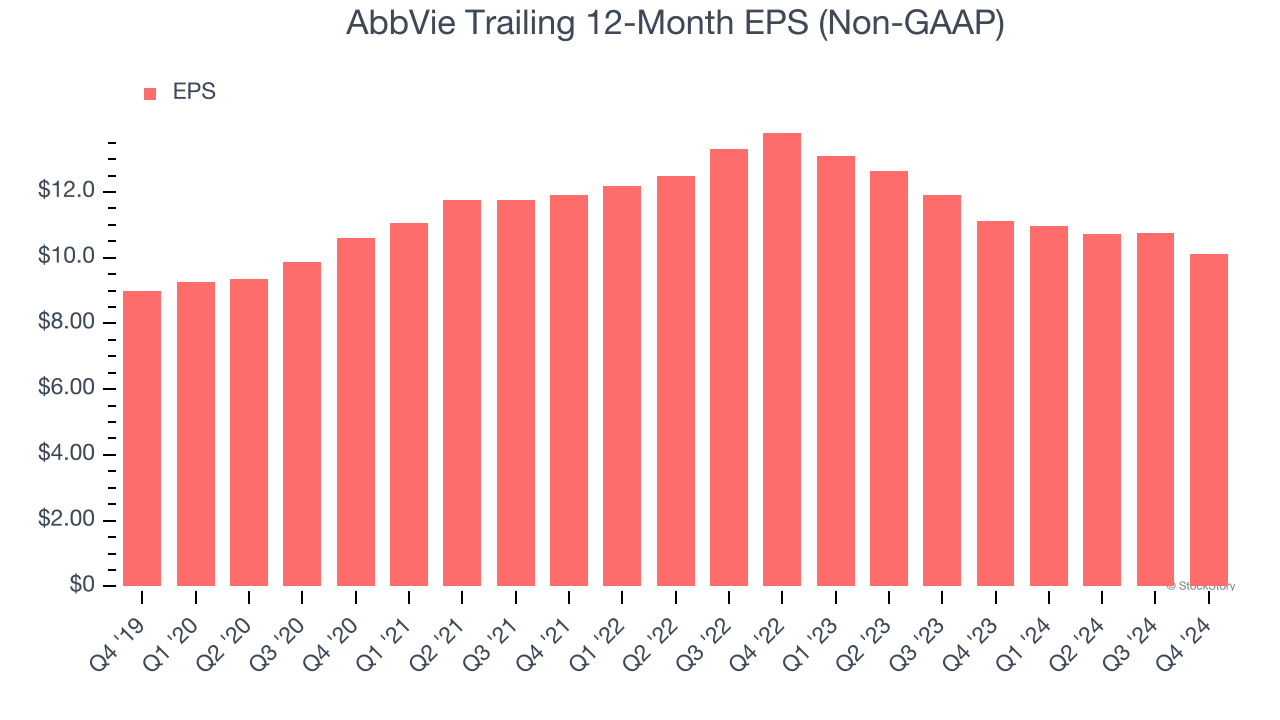
3. EPS Barely Growing
Analyzing the long-term change in earnings per share (EPS) shows whether a company's incremental sales were profitable – for example, revenue could be inflated through excessive spending on advertising and promotions.
AbbVie’s unimpressive 2.4% annual EPS growth over the last five years aligns with its revenue performance. This tells us it maintained its per-share profitability as it expanded.
Final Judgment
AbbVie isn’t a terrible business, but it isn’t one of our picks. That said, the stock currently trades at 16.7× forward price-to-earnings (or $205.51 per share). Beauty is in the eye of the beholder, but we don’t really see a big opportunity at the moment. We're fairly confident there are better stocks to buy right now. Let us point you toward an all-weather company that owns household favorite Taco Bell.
Stocks We Would Buy Instead of AbbVie
With rates dropping, inflation stabilizing, and the elections in the rearview mirror, all signs point to the start of a new bull run - and we’re laser-focused on finding the best stocks for this upcoming cycle.
Put yourself in the driver’s seat by checking out our Top 9 Market-Beating Stocks. This is a curated list of our High Quality stocks that have generated a market-beating return of 175% over the last five years.
Stocks that made our list in 2019 include now familiar names such as Nvidia (+2,183% between December 2019 and December 2024) as well as under-the-radar businesses like Comfort Systems (+751% five-year return). Find your next big winner with StockStory today for free.