
Over the last six months, Graphic Packaging Holding’s shares have sunk to $26.27, producing a disappointing 10.5% loss - a stark contrast to the S&P 500’s 5.1% gain. This was partly driven by its softer quarterly results and may have investors wondering how to approach the situation.
Is there a buying opportunity in Graphic Packaging Holding, or does it present a risk to your portfolio? Check out our in-depth research report to see what our analysts have to say, it’s free.
Even with the cheaper entry price, we don't have much confidence in Graphic Packaging Holding. Here are three reasons why we avoid GPK and a stock we'd rather own.
Why Do We Think Graphic Packaging Holding Will Underperform?
Founded in 1991, Graphic Packaging (NYSE: GPK) is a provider of paper-based packaging solutions for a wide range of products.
1. Demand Slipping as Sales Volumes Decline
Revenue growth can be broken down into changes in price and volume (the number of units sold). While both are important, volume is the lifeblood of a successful Industrial Packaging company because there’s a ceiling to what customers will pay.
Over the last two years, Graphic Packaging Holding’s units sold averaged 4.5% year-on-year declines. This performance was underwhelming and implies there may be increasing competition or market saturation. It also suggests Graphic Packaging Holding might have to lower prices or invest in product improvements to grow, factors that can hinder near-term profitability. 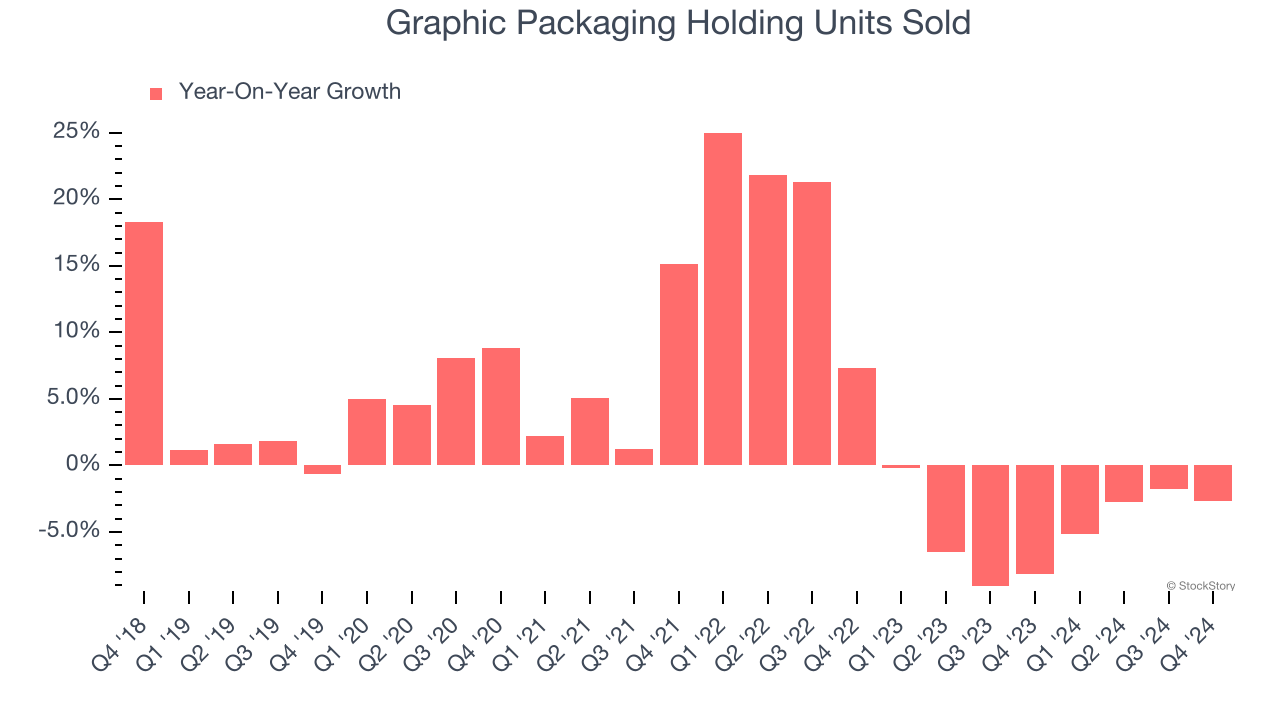
2. Revenue Projections Show Stormy Skies Ahead
Forecasted revenues by Wall Street analysts signal a company’s potential. Predictions may not always be accurate, but accelerating growth typically boosts valuation multiples and stock prices while slowing growth does the opposite.
Over the next 12 months, sell-side analysts expect Graphic Packaging Holding’s revenue to drop by 1.2%. Although this projection is better than its two-year trend, it's tough to feel optimistic about a company facing demand difficulties.
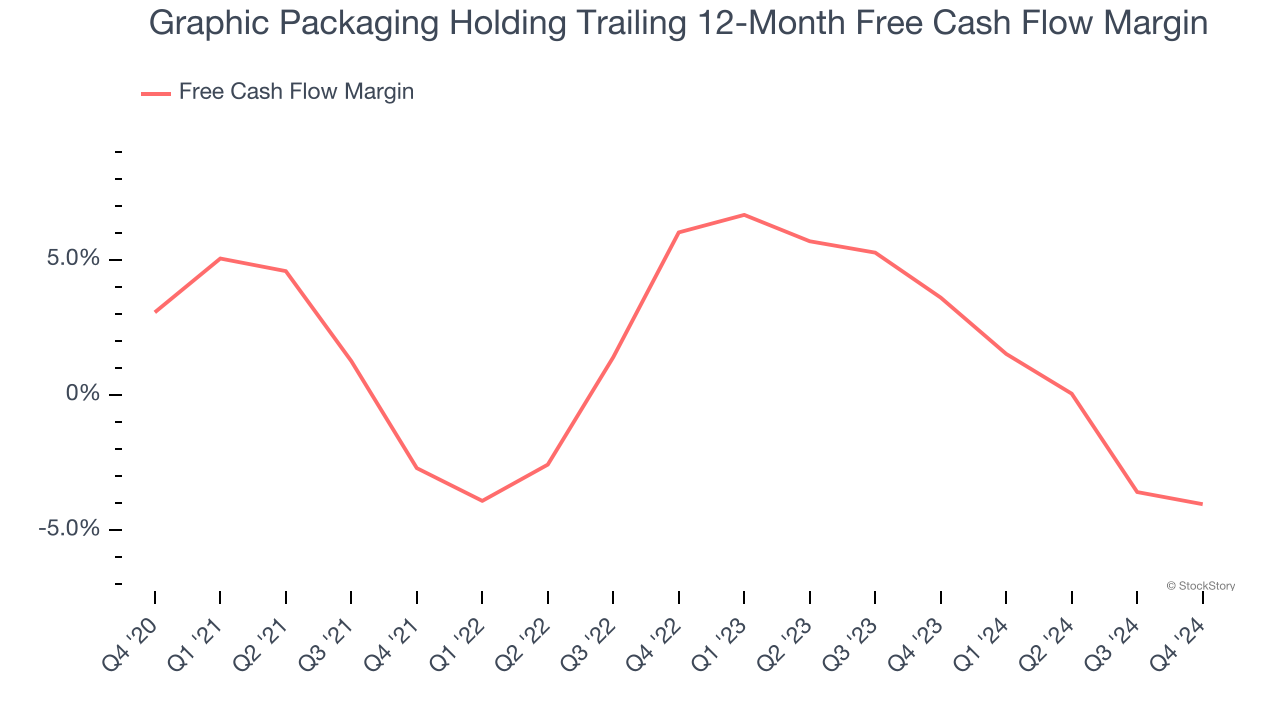
3. Free Cash Flow Margin Dropping
Free cash flow isn't a prominently featured metric in company financials and earnings releases, but we think it's telling because it accounts for all operating and capital expenses, making it tough to manipulate. Cash is king.
As you can see below, Graphic Packaging Holding’s margin dropped by 7.1 percentage points over the last five years. Almost any movement in the wrong direction is undesirable because of its already low cash conversion. If the trend continues, it could signal it’s becoming a more capital-intensive business. Graphic Packaging Holding’s free cash flow margin for the trailing 12 months was negative 4%.
Final Judgment
We cheer for all companies making their customers lives easier, but in the case of Graphic Packaging Holding, we’ll be cheering from the sidelines. Following the recent decline, the stock trades at 9.8× forward price-to-earnings (or $26.27 per share). While this valuation is optically cheap, the potential downside is huge given its shaky fundamentals. There are better investments elsewhere. We’d recommend looking at an all-weather company that owns household favorite Taco Bell.
Stocks We Would Buy Instead of Graphic Packaging Holding
With rates dropping, inflation stabilizing, and the elections in the rearview mirror, all signs point to the start of a new bull run - and we’re laser-focused on finding the best stocks for this upcoming cycle.
Put yourself in the driver’s seat by checking out our Top 6 Stocks for this week. This is a curated list of our High Quality stocks that have generated a market-beating return of 175% over the last five years.
Stocks that made our list in 2019 include now familiar names such as Nvidia (+2,183% between December 2019 and December 2024) as well as under-the-radar businesses like Sterling Infrastructure (+1,096% five-year return). Find your next big winner with StockStory today for free.


