ANSYS trades at $346 per share and has stayed right on track with the overall market, gaining 16.7% over the last six months. At the same time, the S&P 500 has returned 14.7%.
Is ANSS a buy right now? Find out in our full research report, it’s free.
Why Does ANSS Stock Spark Debate?
Used to help design the Mars Rover, Ansys (NASDAQ: ANSS) offers a software-as-a-service platform that enables simulation for engineering and design.
Two Positive Attributes:
1. Elite Gross Margin Powers Best-In-Class Business Model
What makes the software-as-a-service model so attractive is that once the software is developed, it usually doesn’t cost much to provide it as an ongoing service. These minimal costs can include servers, licenses, and certain personnel.
ANSYS’s gross margin is one of the highest in the software sector, an output of its asset-lite business model and strong pricing power. It also enables the company to fund large investments in new products and sales during periods of rapid growth to achieve higher profits in the future. As you can see below, it averaged an elite 91.4% gross margin over the last year. That means ANSYS only paid its providers $8.58 for every $100 in revenue. 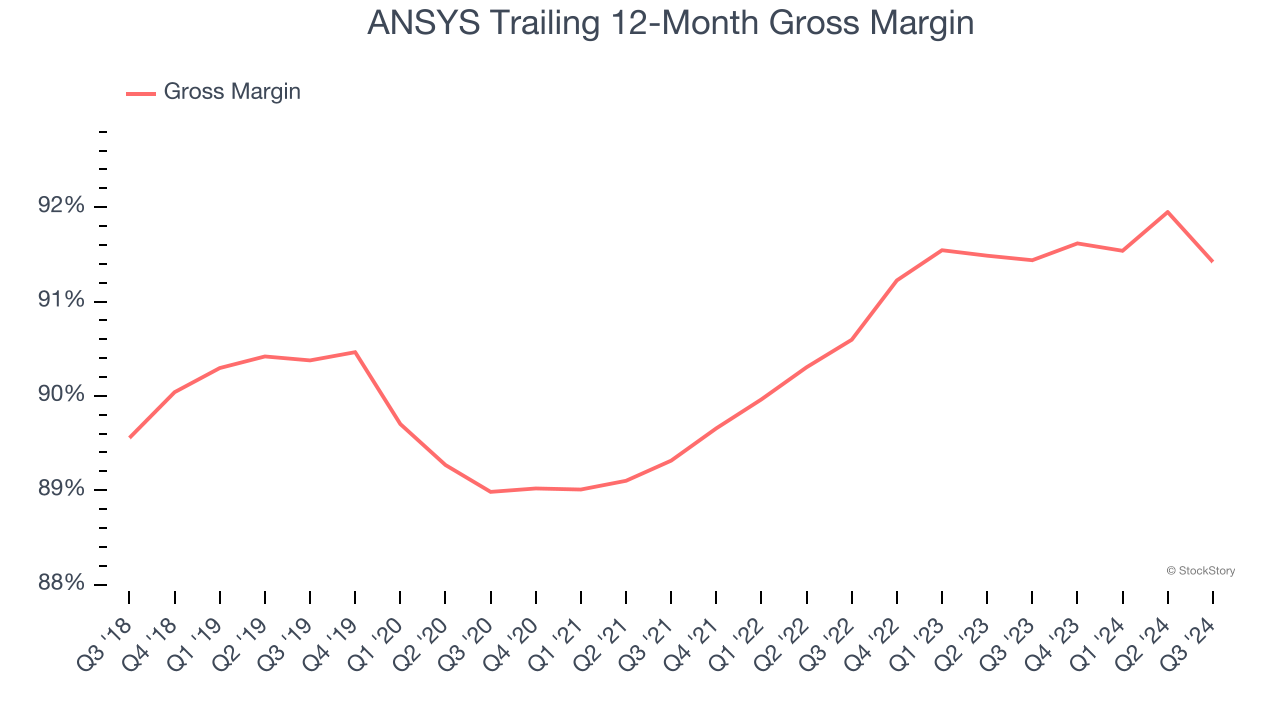
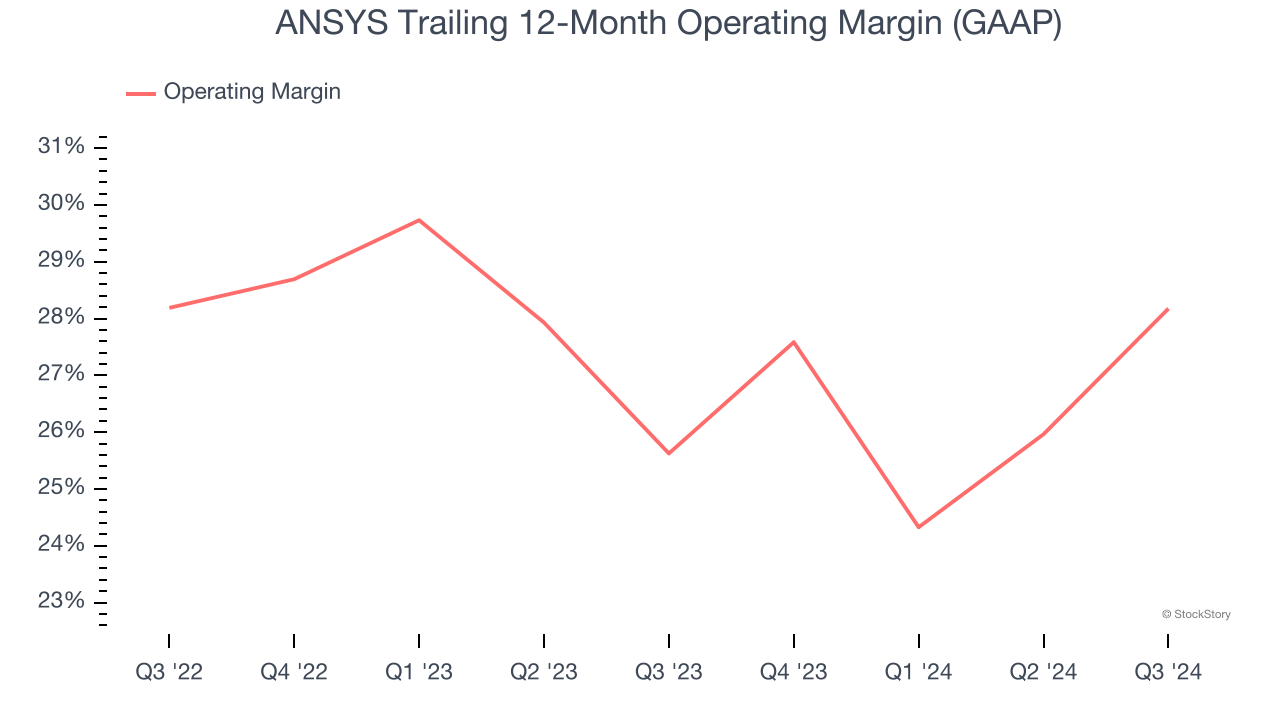
2. Operating Margin Reveals a Well-Run Organization
Many software businesses adjust their profits for stock-based compensation (SBC), but we prioritize GAAP operating margin because SBC is a real expense used to attract and retain engineering and sales talent. This is one of the best measures of profitability because it shows how much money a company takes home after developing, marketing, and selling its products.
ANSYS has been a well-oiled machine over the last year. It demonstrated elite profitability for a software business, boasting an average operating margin of 28.2%. This result isn’t surprising as its high gross margin gives it a favorable starting point.
One Reason to be Careful:
Long-Term Revenue Growth Disappoints
A company’s long-term sales performance can indicate its overall quality. Any business can put up a good quarter or two, but many enduring ones grow for years. Unfortunately, ANSYS’s 9.6% annualized revenue growth over the last three years was sluggish. This fell short of our benchmark for the software sector, but there are still things to like about ANSYS. 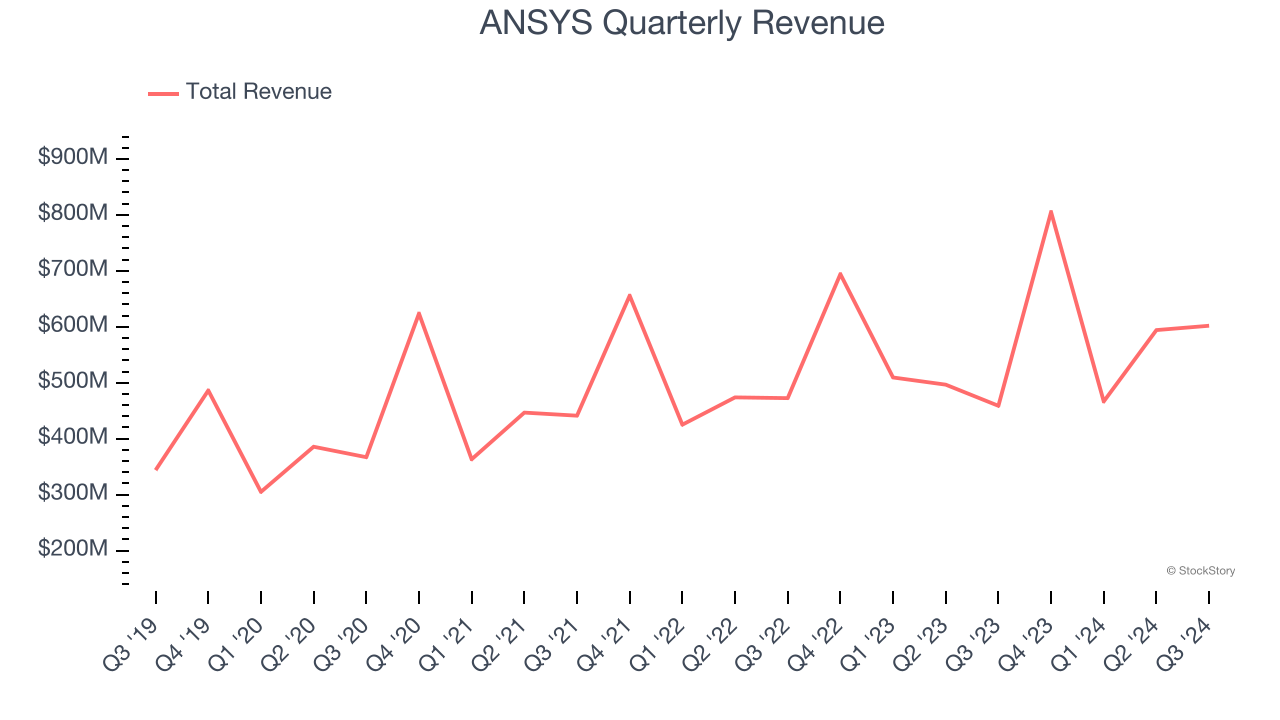
Final Judgment
ANSYS’s positive characteristics outweigh the negatives, but at $346 per share (or 11.5× forward price-to-sales), is now the right time to buy the stock? See for yourself in our in-depth research report, it’s free.
Stocks We Like Even More Than ANSYS
The Trump trade may have passed, but rates are still dropping and inflation is still cooling. Opportunities are ripe for those ready to act - and we’re here to help you pick them.
Get started by checking out our Top 5 Growth Stocks for this month. This is a curated list of our High Quality stocks that have generated a market-beating return of 175% over the last five years.
Stocks that made our list in 2019 include now familiar names such as Nvidia (+2,183% between December 2019 and December 2024) as well as under-the-radar businesses like Sterling Infrastructure (+1,096% five-year return). Find your next big winner with StockStory today for free.